Data layers & Intelligence

Charts over time and the Trend widget

8 min read
The chart widgets can read the past as well as today. You can show a chart as it stood on a day, set that day beside today, and count only the records that changed, improved or declined over a window. The Trend widget draws one field over time as lines. It takes about ten minutes.

Before you start

These choices need a data layer switched on for your workspace (see Turn on a data layer) with at least one field whose past is kept, and a role that can see that layer. For some layers that history begins only recently and grows over time.

You need a dashboard with chart widgets on it: see Use the chart widgets: Portfolio, Intel and Comparison and Customise your Home dashboard.

Note

The figures in these pictures are examples over a handful of invented records. They are not real statistics. The pictures use the Care Quality Commission data layer, whose ratings are kept over time; the fields and choices you see depend on the data layers your workspace has switched on.

Start from a chart read today

Open a dashboard with Headline figures, Breakdown, Cross-tab or the Map on it. Each shows today’s figures until you choose otherwise.
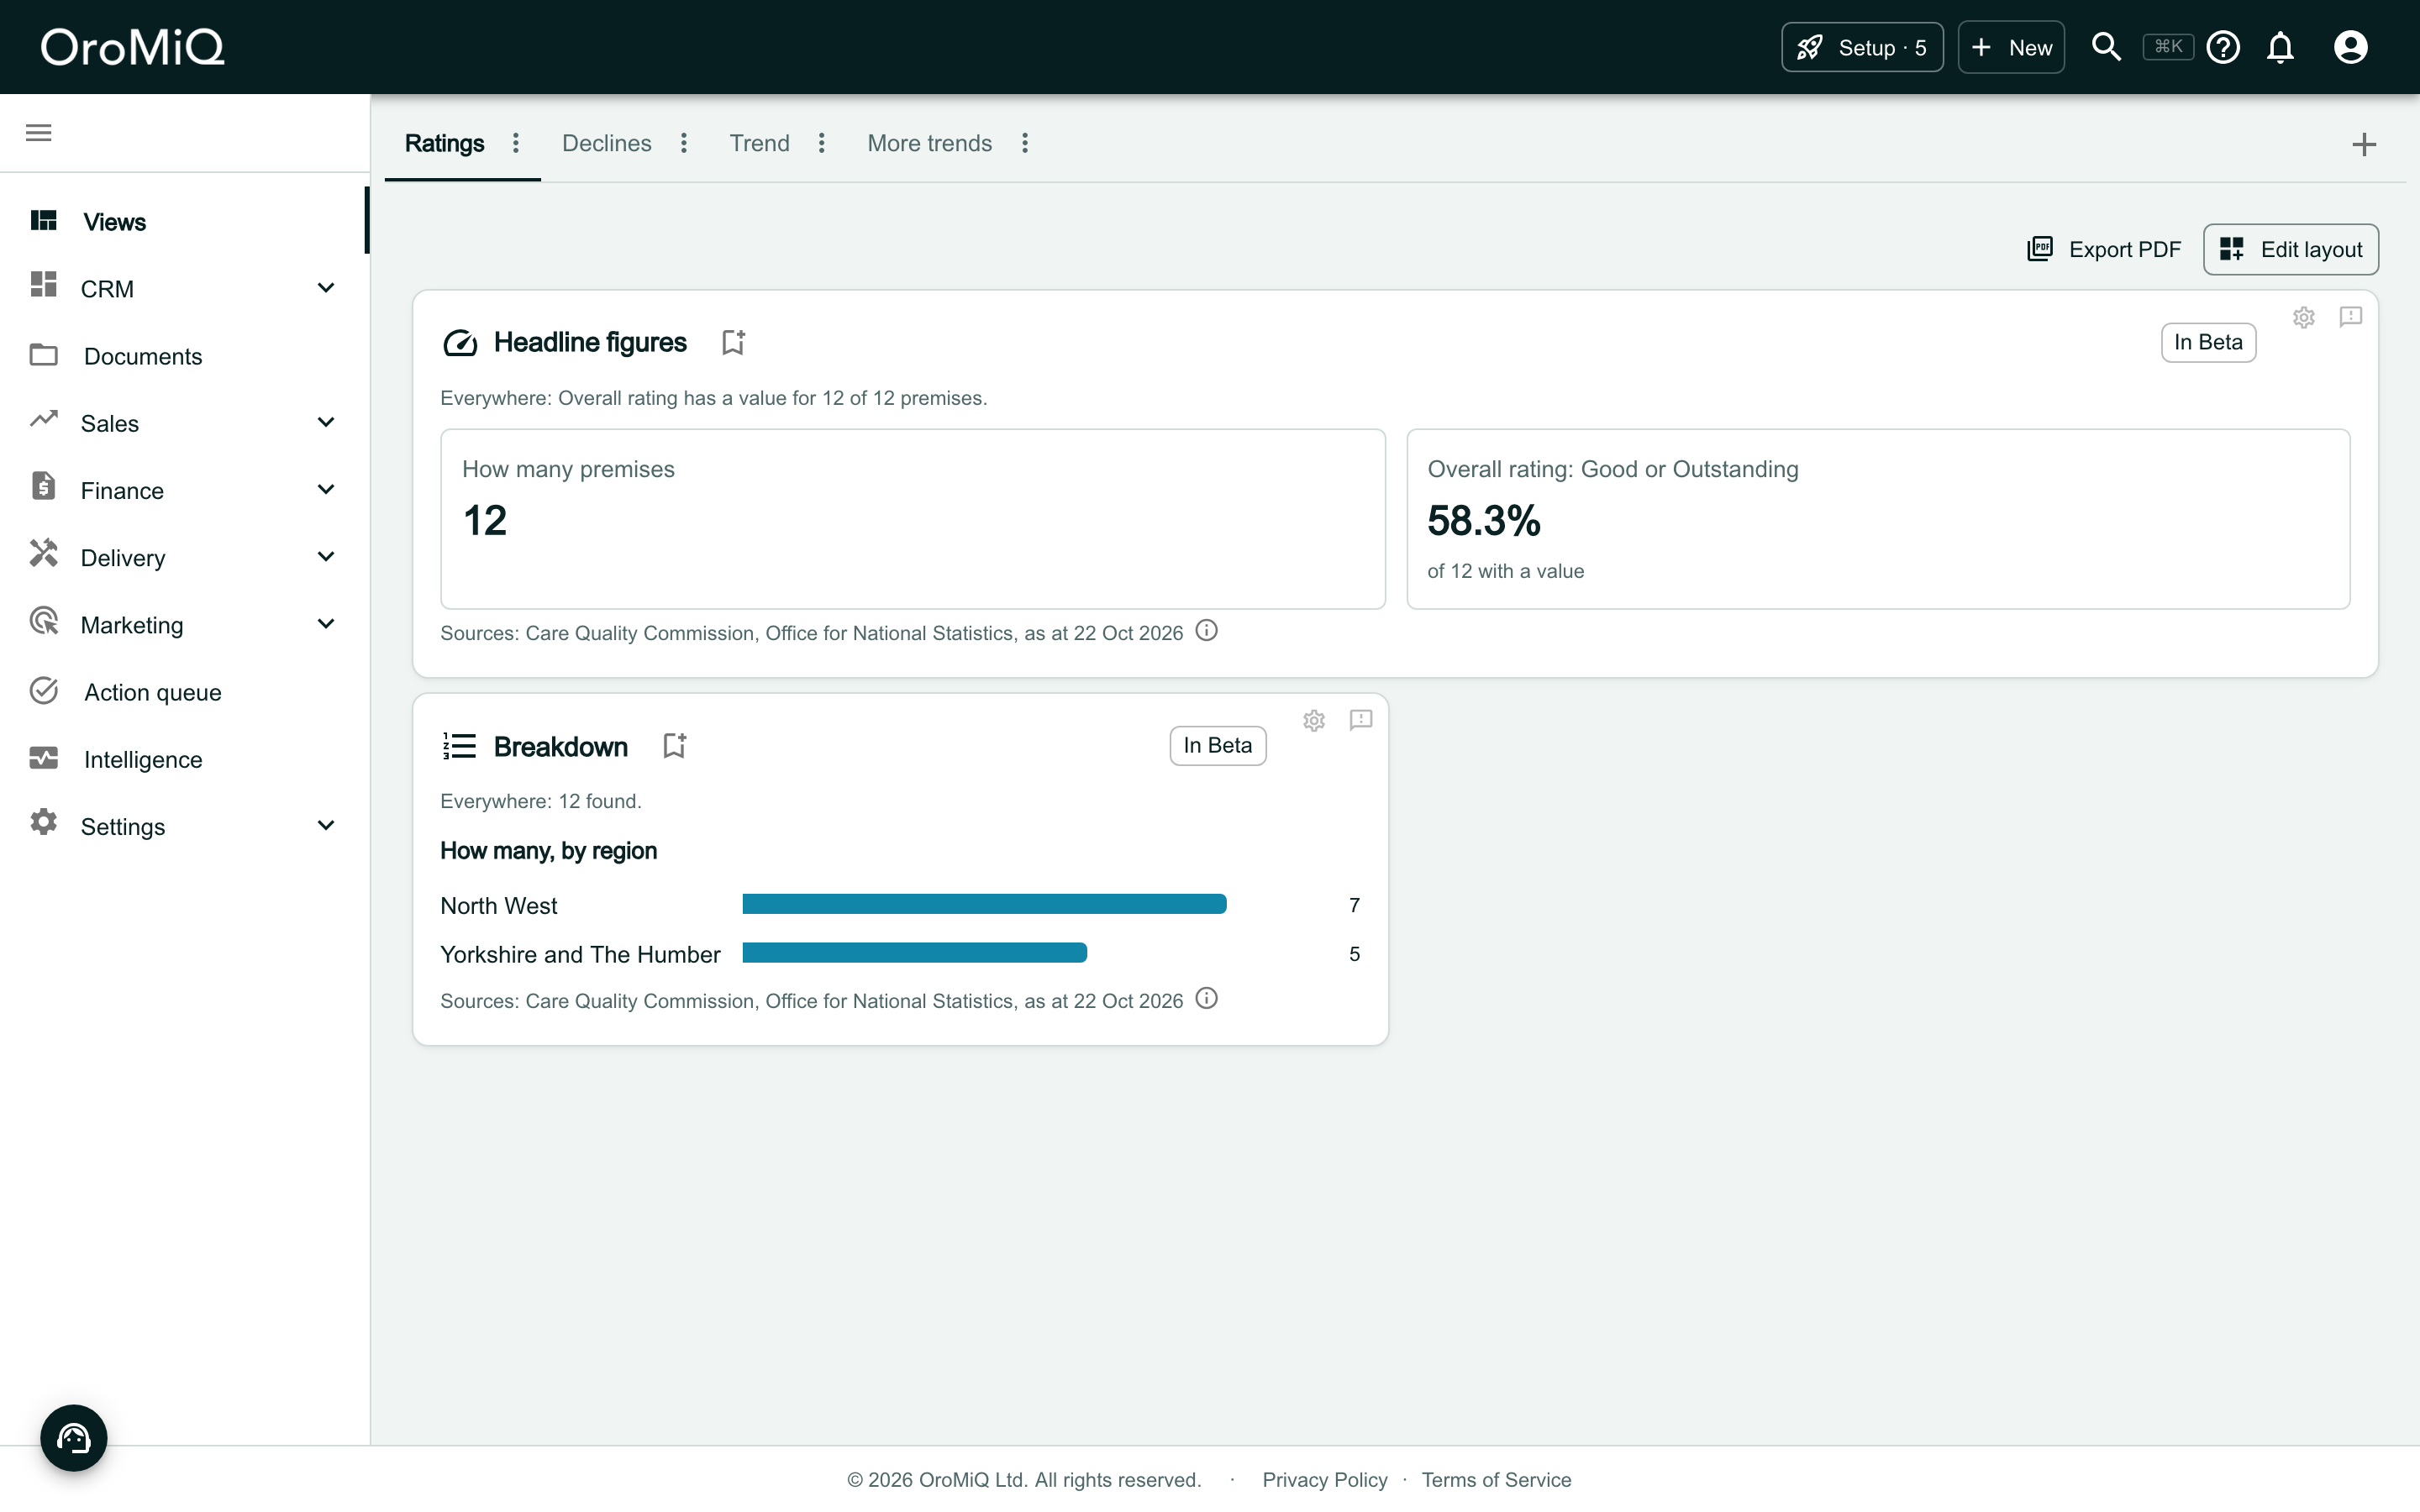
A dashboard tab called Ratings in Views, beside the tabs Trend and More trends. Headline figures shows How many premises 12 and Overall rating: Good or Outstanding 58.3% of 12 with a value. Breakdown shows How many, by region with bars for North West 7 and Yorkshire and The Humber 5. Each card ends with a Sources line.

Choose When

Click the gear icon on the card. Under When, open As at and choose A day in the past.

When appears in these four widgets when the widget’s data layer has a field whose past is kept.

The When section of a widget’s settings, with the As at choice open, listing Today and A day in the past.

Pick the day

Type a day into Day, or pick one from the calendar. The line under the field says how far back you can go: from where the history begins up to yesterday.

Click Apply.
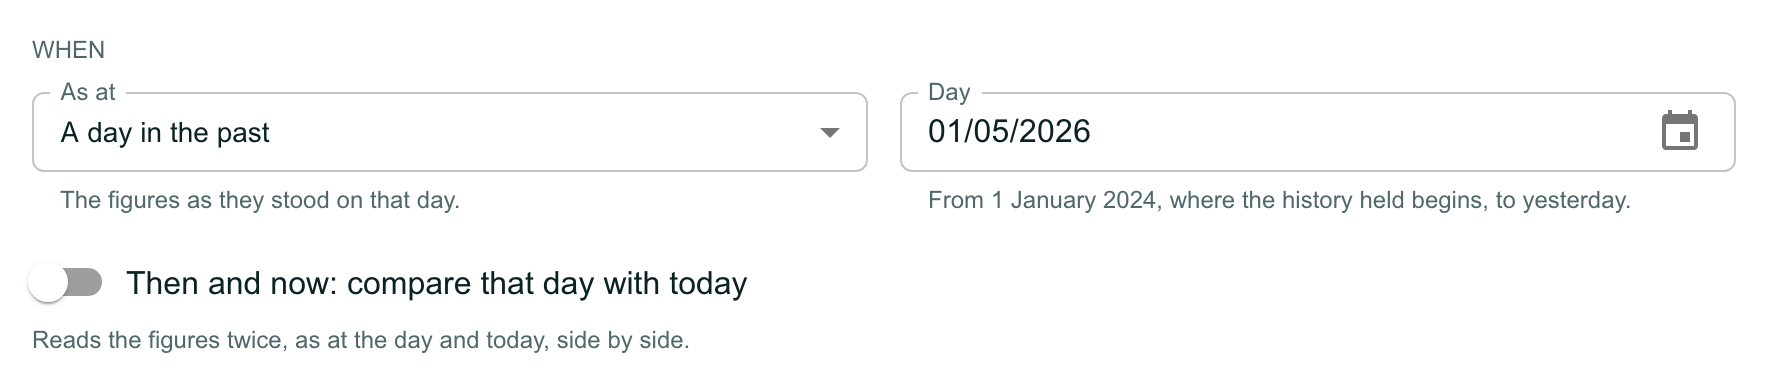
The When section with As at set to A day in the past, the line The figures as they stood on that day, and a Day field reading 01/05/2026 with the line From 1 January 2024, where the history held begins, to yesterday. Below is a switch, off, labelled Then and now: compare that day with today, with the line Reads the figures twice, as at the day and today, side by side.

Read the chart as at that day

The card says As at and the day under its title, and every figure is as it stood then. Here 75% of the premises were rated Good or Outstanding on that day, against 58.3% today.
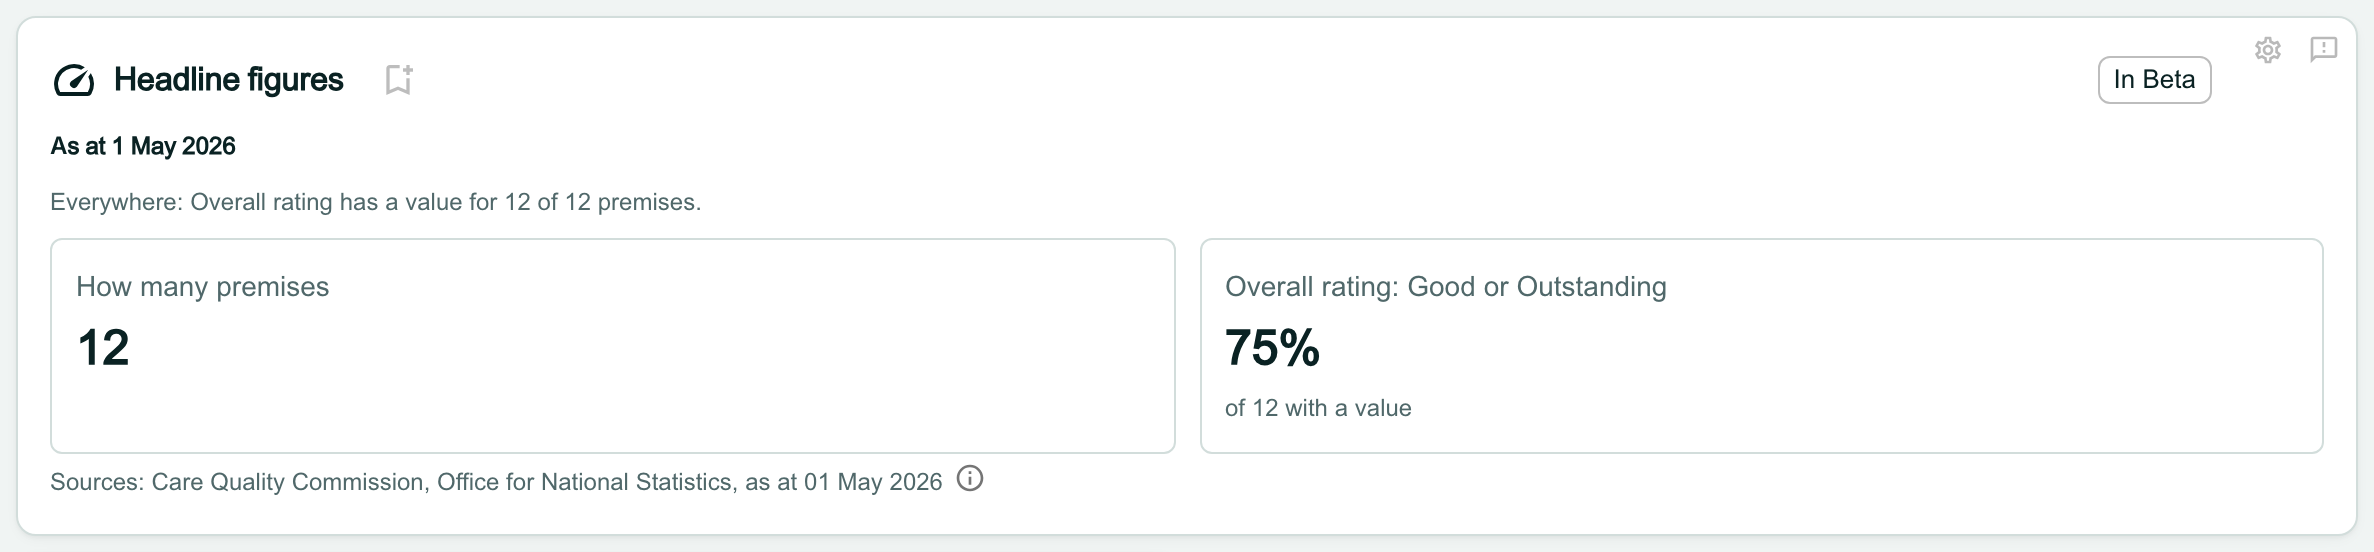
The Headline figures card with the line As at 1 May 2026 under its title. It shows How many premises 12 and Overall rating: Good or Outstanding 75% of 12 with a value, and the Sources line ends as at 01 May 2026.

Know why you cannot save it as a report

A saved report is re-run every time the data is updated, so it cannot keep a chart that reads the past. The Save as a report icon beside the title is greyed out, and pointing at it says why.

To save the chart as a report, set As at back to Today and remove any conditions over the past.
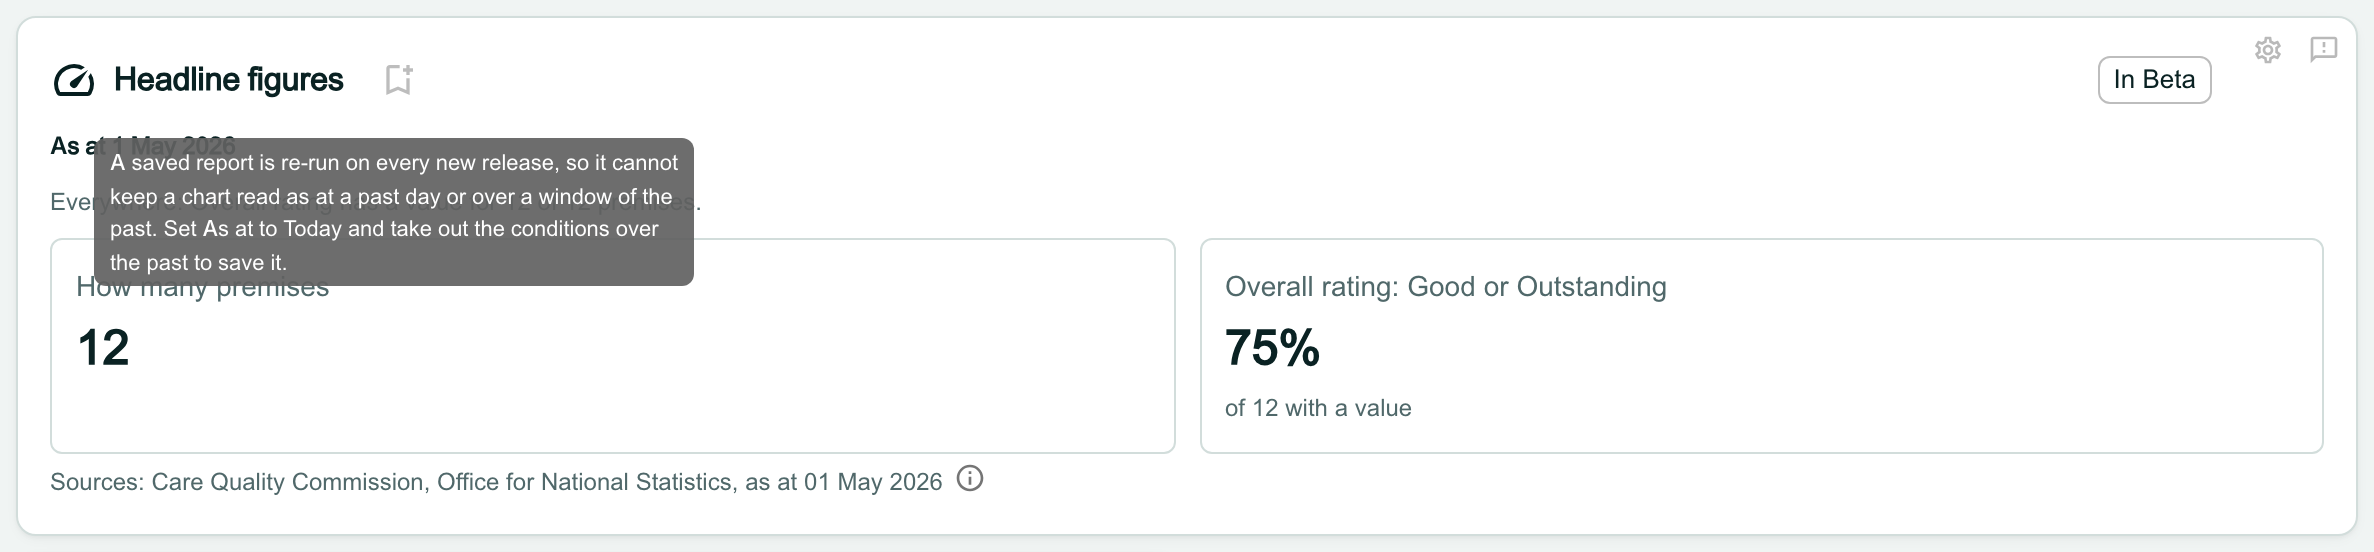
The same card with the pointer over the greyed-out save icon beside the title, and a tooltip reading A saved report is re-run on every new release, so it cannot keep a chart read as at a past day or over a window of the past. Set As at to Today and take out the conditions over the past to save it.

Compare that day with today

Open the settings again and turn on Then and now: compare that day with today. Click Apply.

Then and now cannot be used while Show is set to Comparison: choose Portfolio or Intel first.
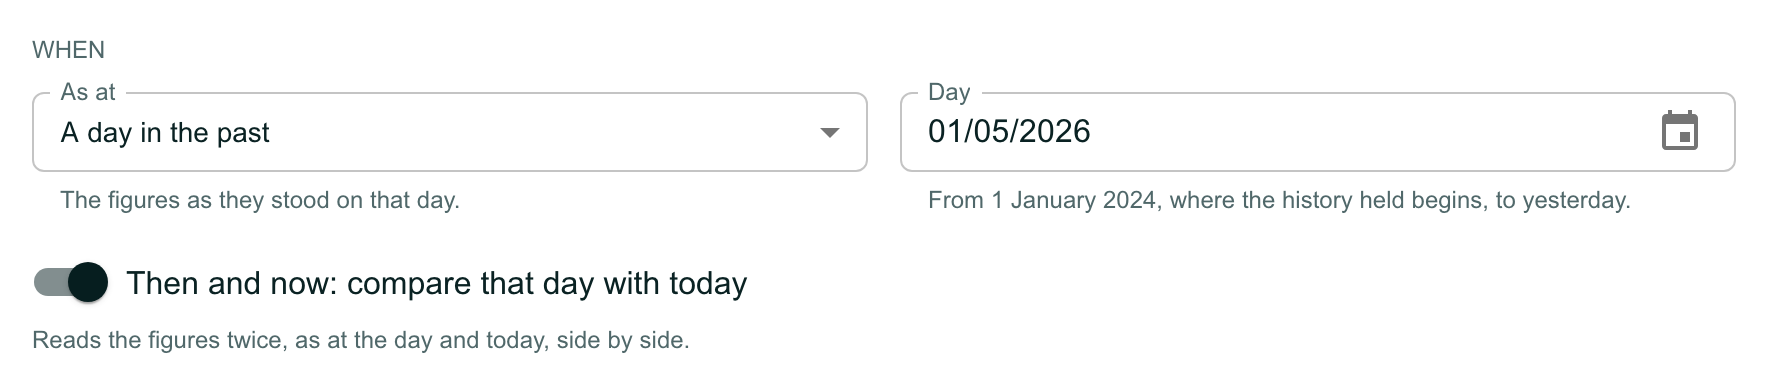
The When section with As at A day in the past, Day 01/05/2026, and the switch Then and now: compare that day with today turned on.

Read then and now

Each tile leads with today’s figure. The day’s figure sits beneath it, with the difference: here the share rated Good or Outstanding fell by 16.7 points. A count that did not move reads No difference.
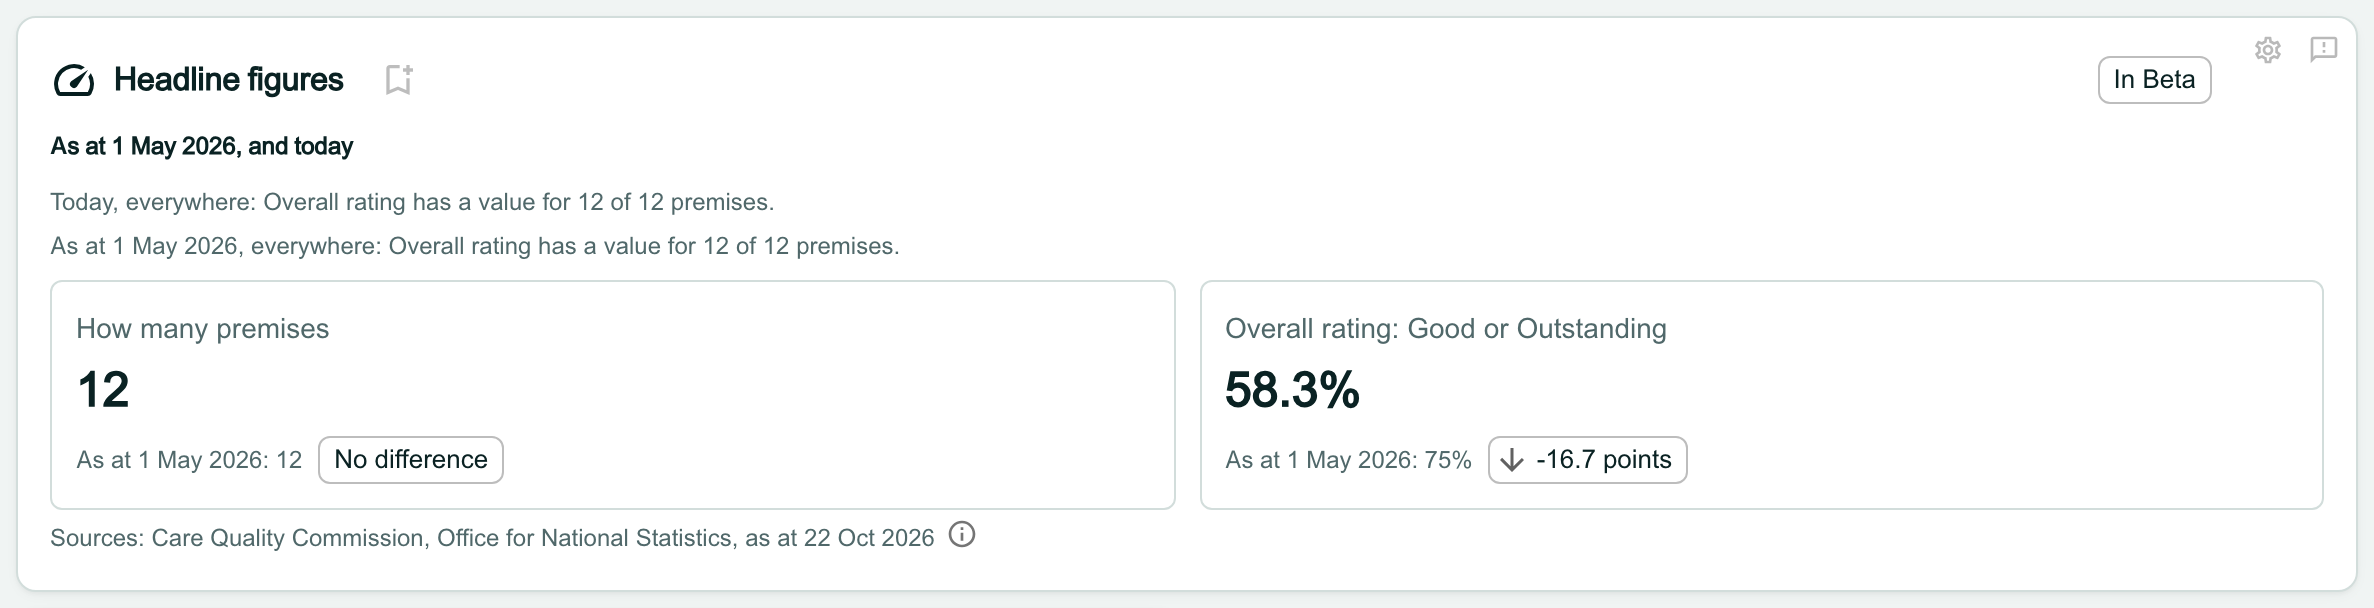
The Headline figures card reading As at 1 May 2026, and today. Two lines say how many premises have a value today and as at 1 May 2026. How many premises shows 12 with As at 1 May 2026: 12 and a No difference chip. Overall rating: Good or Outstanding shows 58.3% with As at 1 May 2026: 75% and a chip reading -16.7 points with a down arrow.

Add a condition over the past

A condition over the past counts only the records whose value moved in a window. In the widget’s settings, scroll to the conditions and click Add a condition over the past.

Choose the Field. The list holds only the fields whose past is kept.
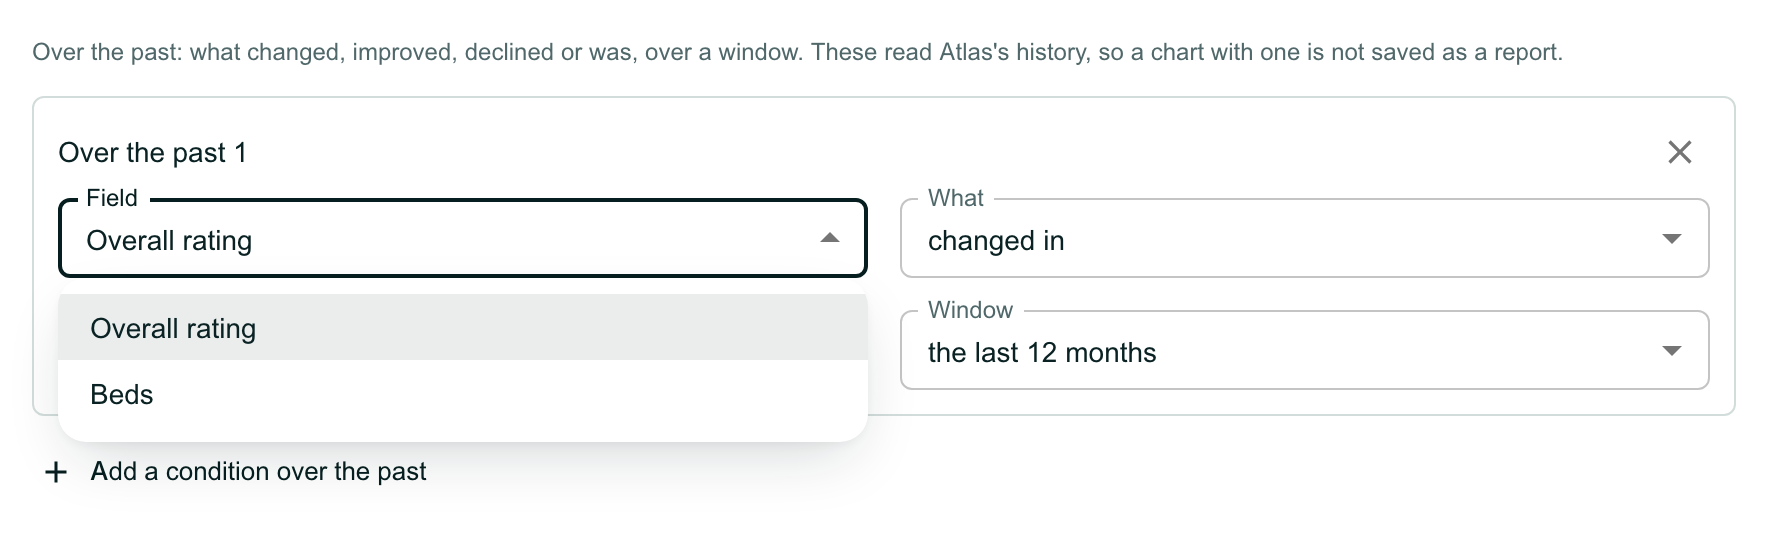
The conditions over the past in a widget’s settings, with the line Over the past: what changed, improved, declined or was, over a window. These read Atlas’s history, so a chart with one is not saved as a report. A box headed Over the past 1 has its Field list open, offering Overall rating and Beds, beside What and Window. Add a condition over the past is below.

Choose what happened

Open What and choose:

  • changed in: the value changed at all.
  • improved in or declined in: the value moved up or down. These are offered only for fields with an order, such as a rating.
  • was ... in: the value was one you choose at some point.

Each field offers only the choices that make sense for it.
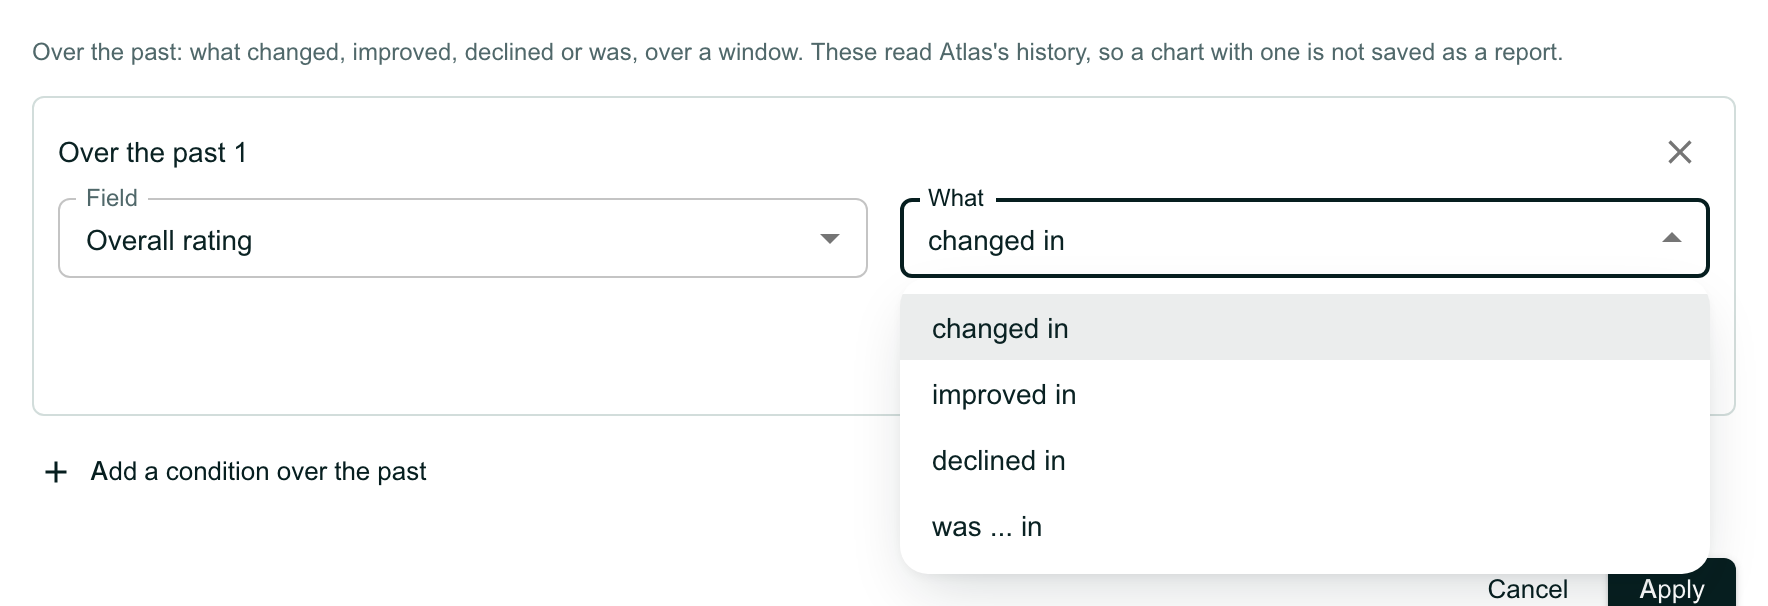
The same box with Field set to Overall rating and the What list open, offering changed in, improved in, declined in and was ... in.

Choose the window

Open Window and choose:

  • the last 3 months, the last 6 months or the last 12 months: the window rolls, so the chart always looks back from the day you open it.
  • between two dates: a fixed window, which stays the same.

Click Apply.
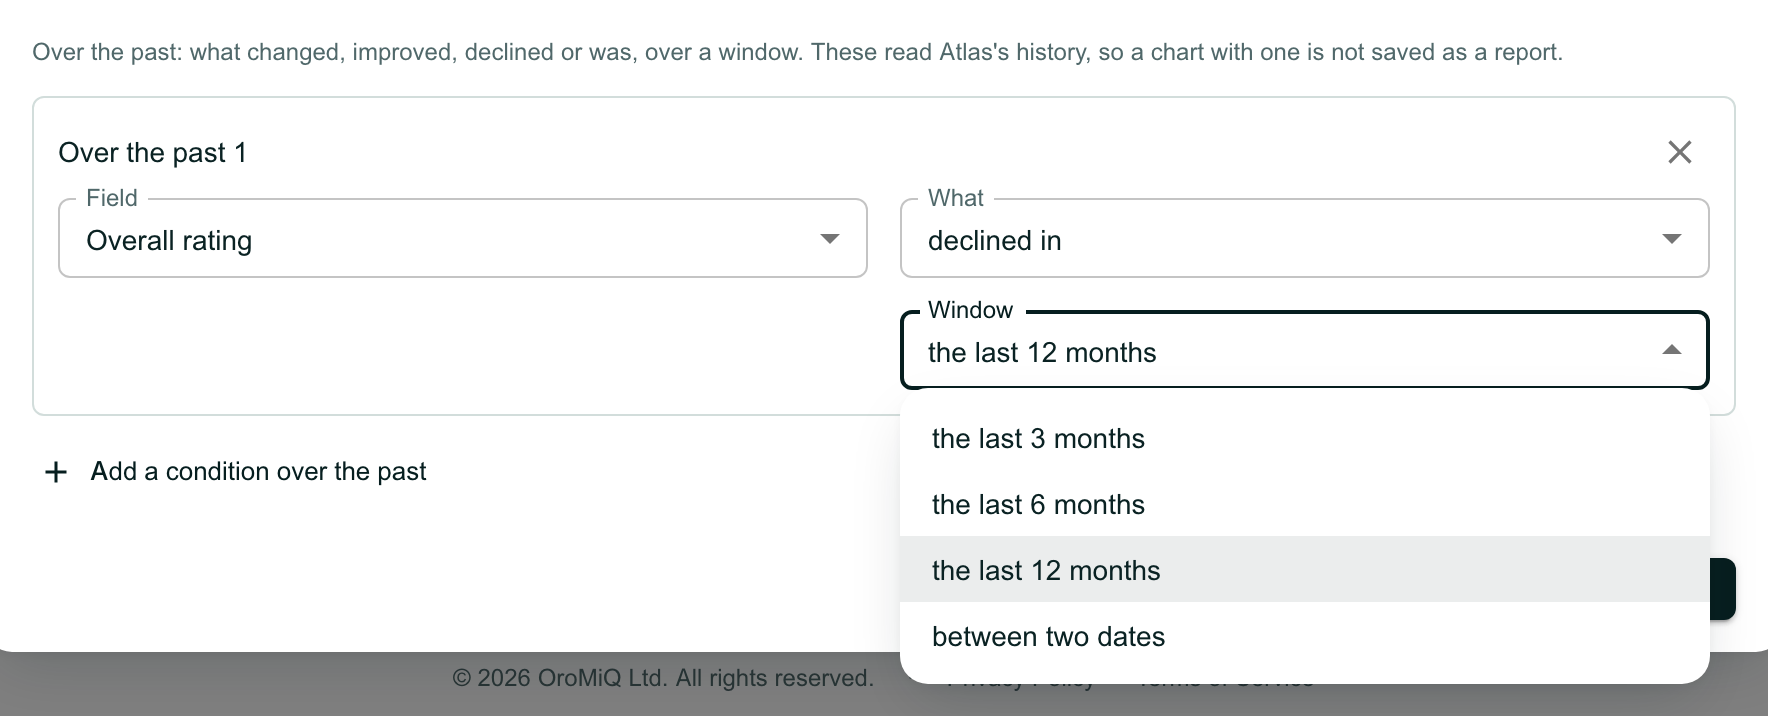
The same box with What set to declined in and the Window list open, offering the last 3 months, the last 6 months, the last 12 months (selected) and between two dates.

Read the chart with the condition

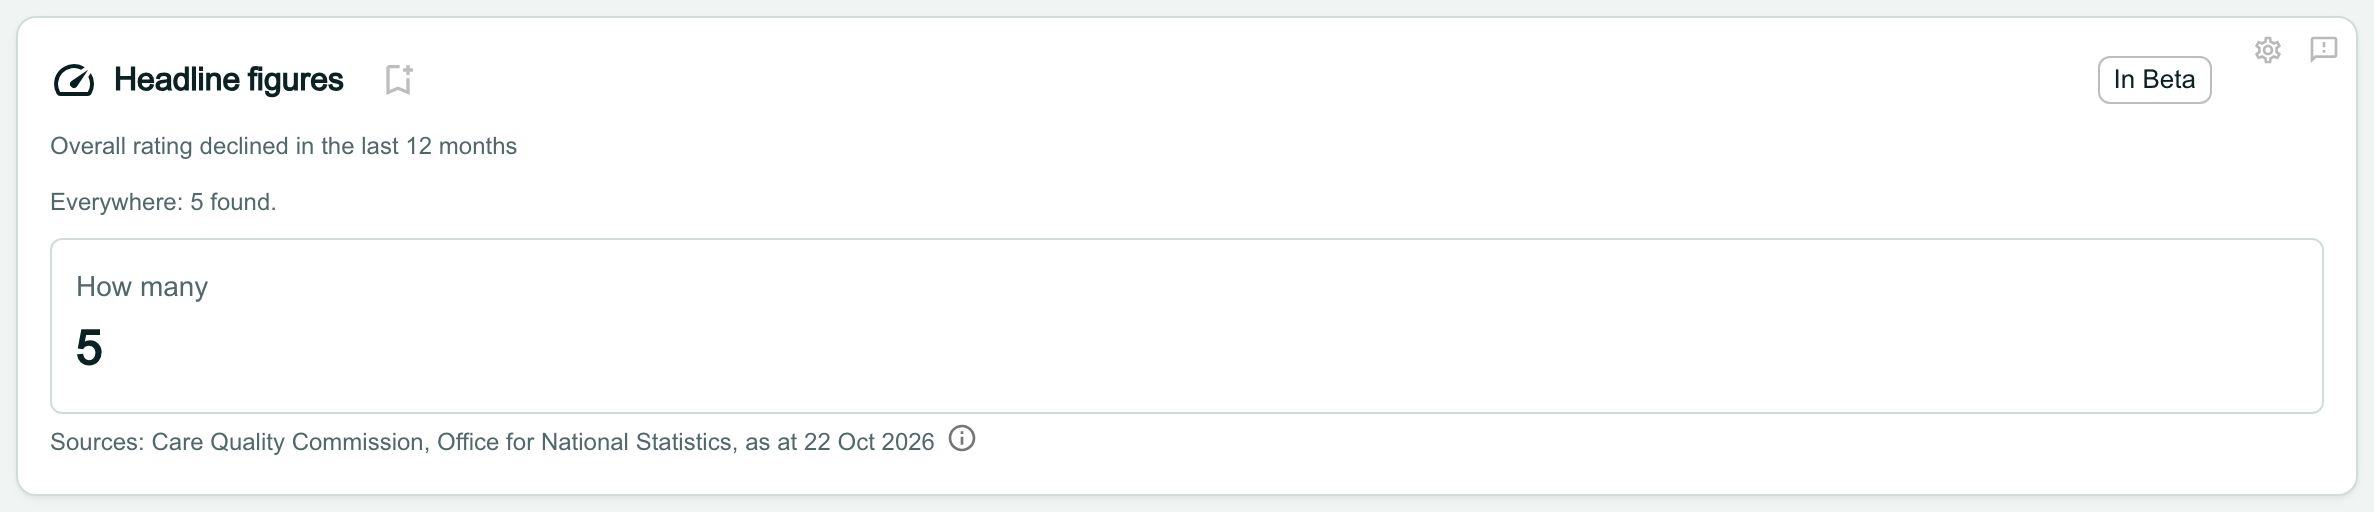
The condition is written out under the card’s title, here Overall rating declined in the last 12 months, and the figures count only the records that meet it. As with a past day, Save as a report is greyed out.

Note
Reading the past can take longer than reading today. If the data service cannot answer in time, the card shows its message in place of the figures, with Try again. Your settings are kept, so you can try again later.
A Headline figures card with the line Overall rating declined in the last 12 months under its title, then Everywhere: 5 found, and How many 5. The save icon beside the title is greyed out.

Add the Trend widget

Open the dashboard you want it on and click Edit layout, then Add widget. Scroll down to Intelligence and click Add beside Trend.

Build a chart, at the top of Add a widget, adds a Trend too, under Line chart: see Build a chart widget. This guide adds the ready-made widget.

The new card says Nothing chosen yet until you open its settings.
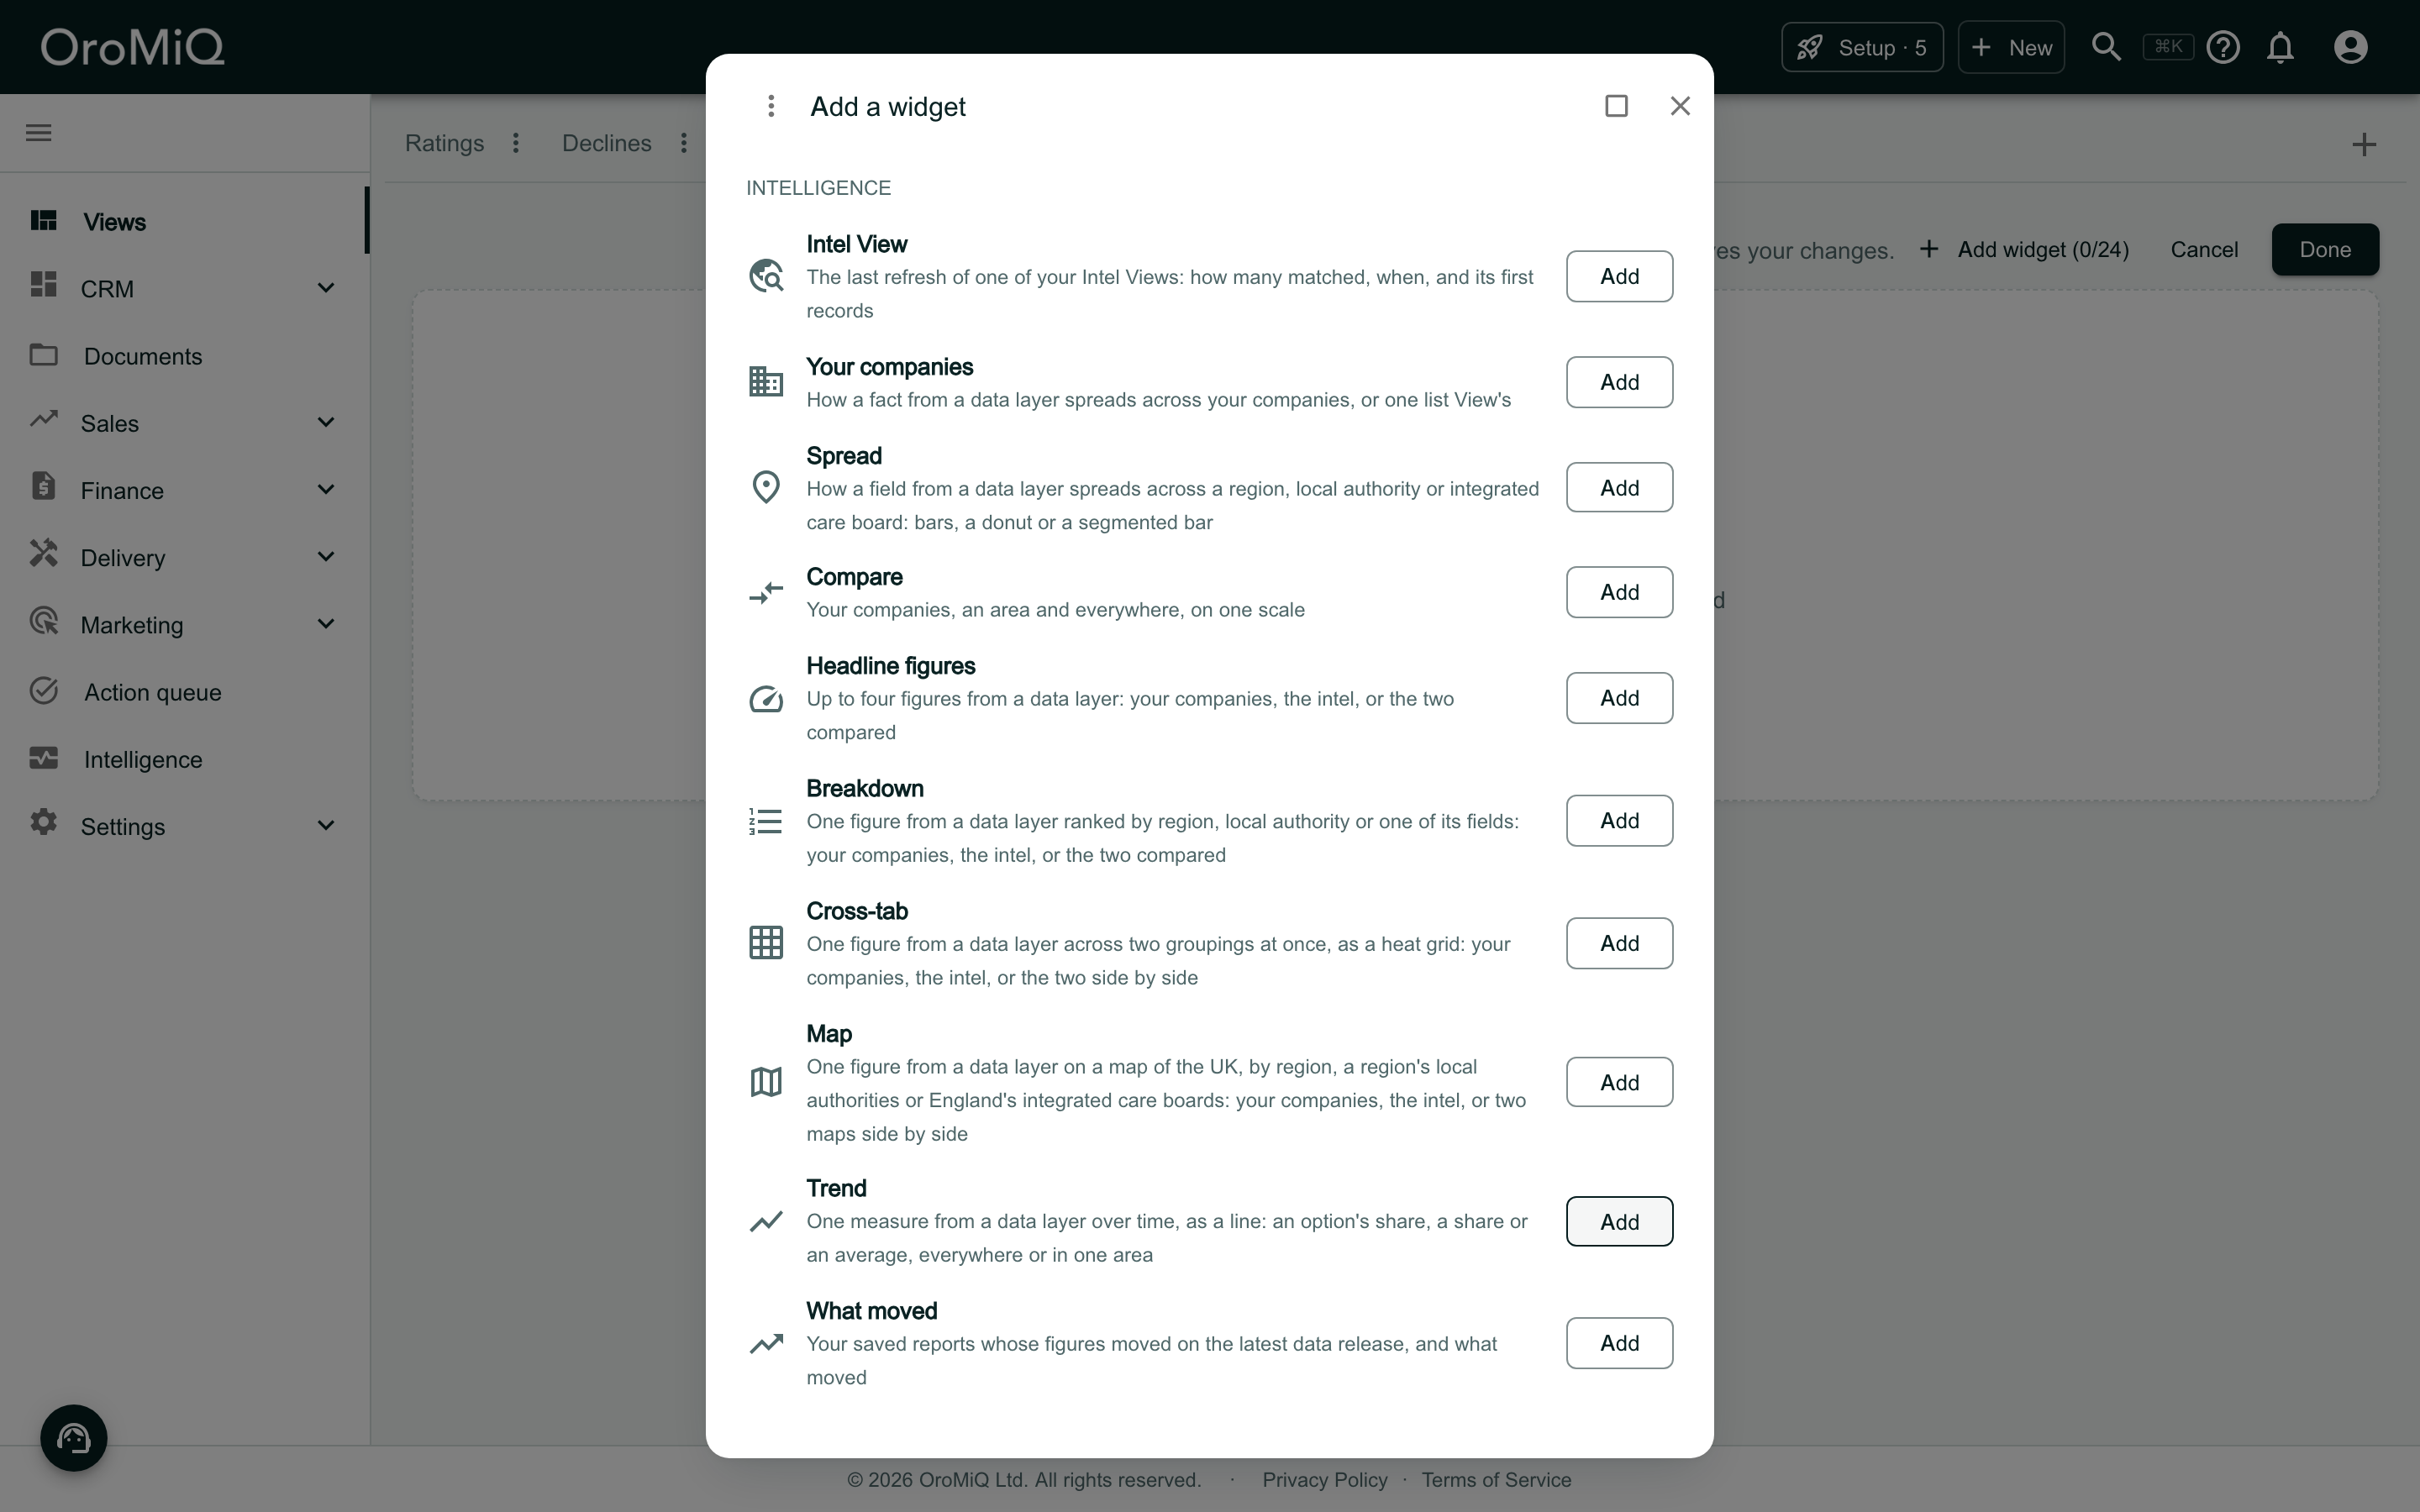
The Add a widget window over a dashboard tab called Trend in Edit layout. Under Intelligence it lists Intel View, Your companies, Spread, Compare, Headline figures, Breakdown, Cross-tab, Map, Trend and What moved, each with an Add button. Trend reads One measure from a data layer over time, as a line: an option’s share, a share or an average, everywhere or in one area.

Choose the data layer and field

Click the gear icon on the card. Choose the Data layer and the Field. Only the layers and fields measured over time are offered.

A trend covers everything the data layer holds, so it takes no conditions and does not show your own companies on their own.
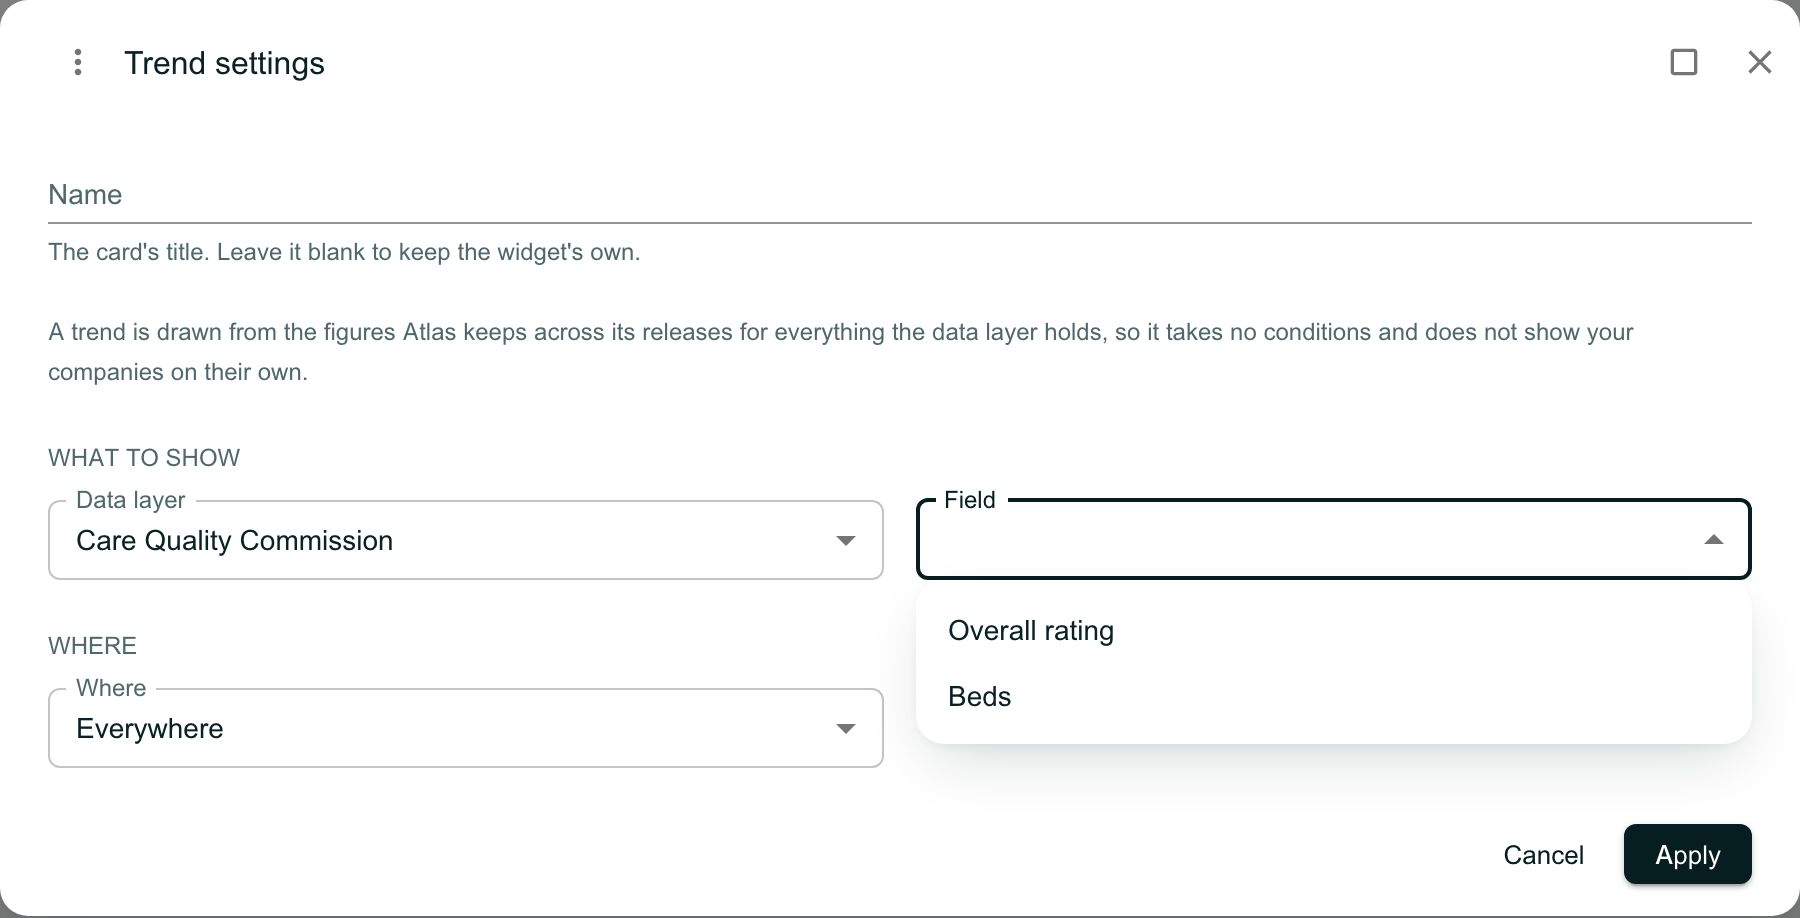
The Trend settings window. A line reads A trend is drawn from the figures Atlas keeps across its releases for everything the data layer holds, so it takes no conditions and does not show your companies on their own. Under What to show, Data layer is Care Quality Commission and the Field list is open, offering Overall rating and Beds. Where is set to Everywhere.

Choose the lines and where

For a field with set values, such as a rating, choose up to four values under Lines: the share of: each draws its own line. For a number, choose the statistic to draw instead, such as the average.

Under Where, choose everywhere, a region or a local authority. Click Apply, then Done to keep the layout.
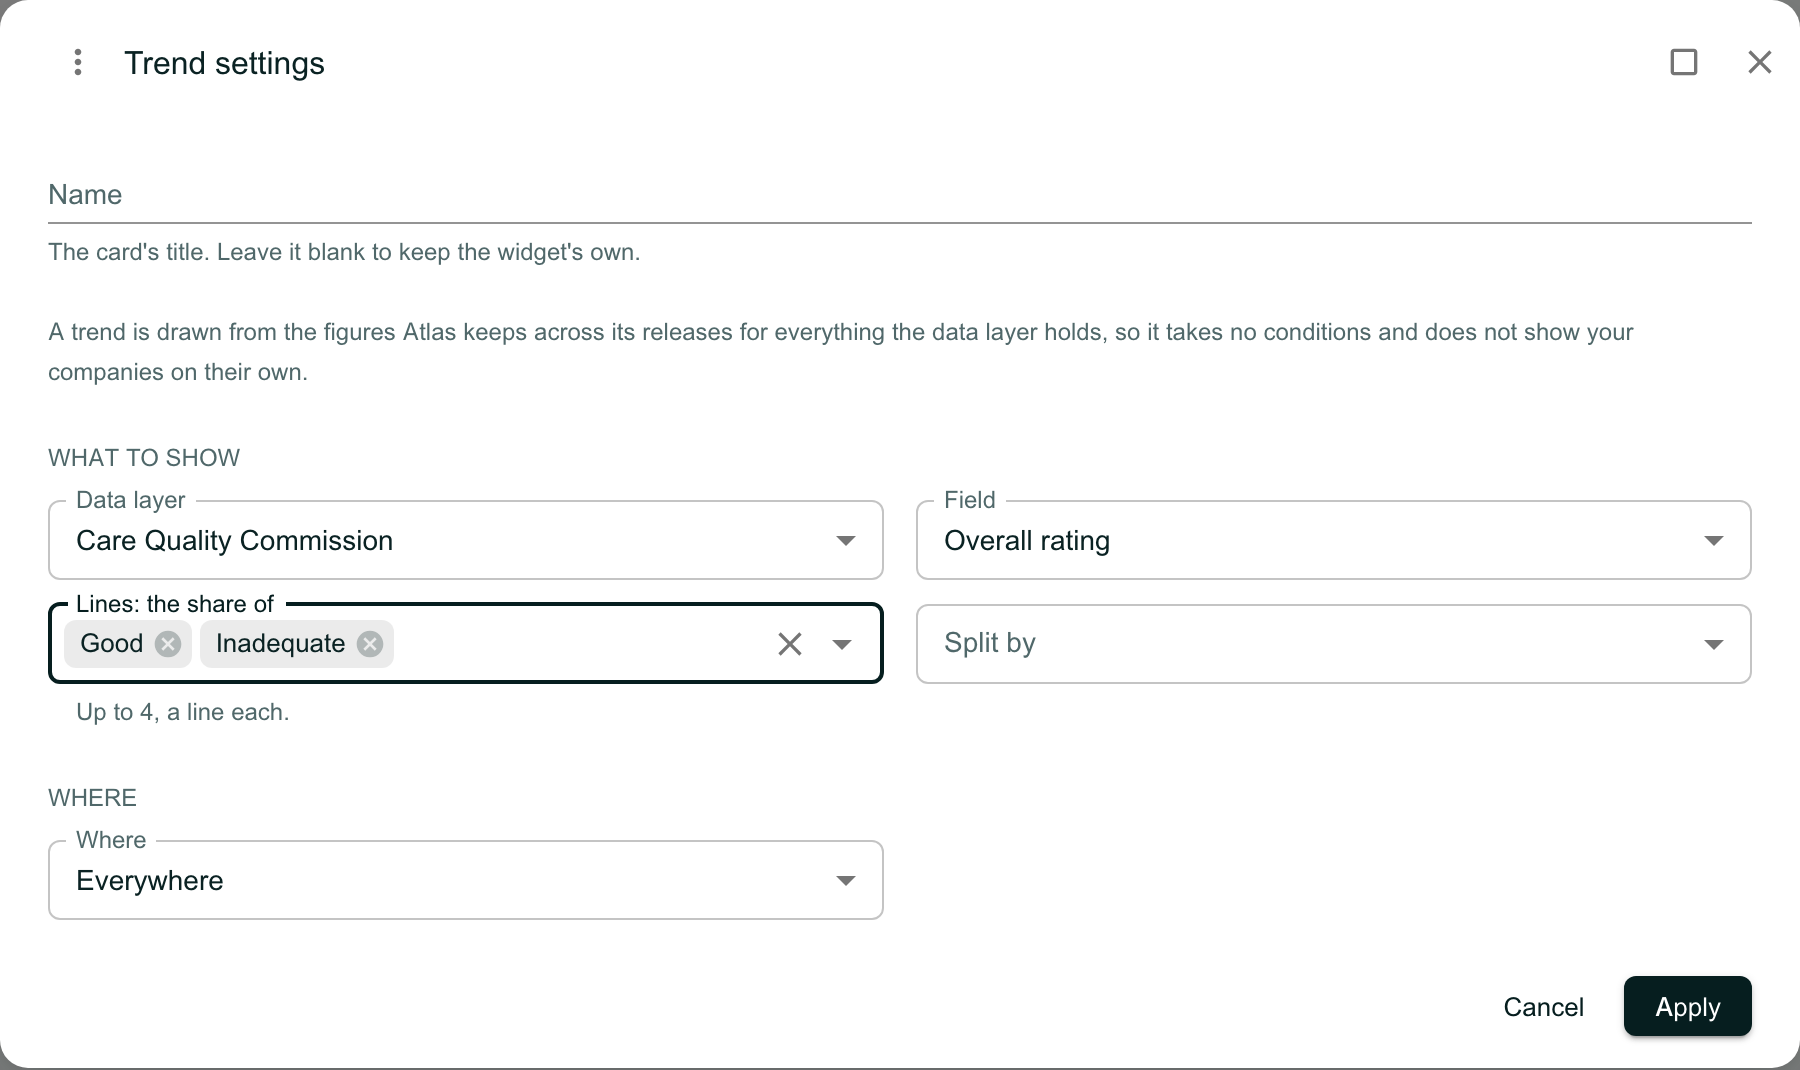
The Trend settings with Data layer Care Quality Commission, Field Overall rating, Lines: the share of Good and Inadequate, with the line Up to 4, a line each, an empty Split by choice, and Where set to Everywhere. Cancel and Apply are at the foot.

Read the Trend

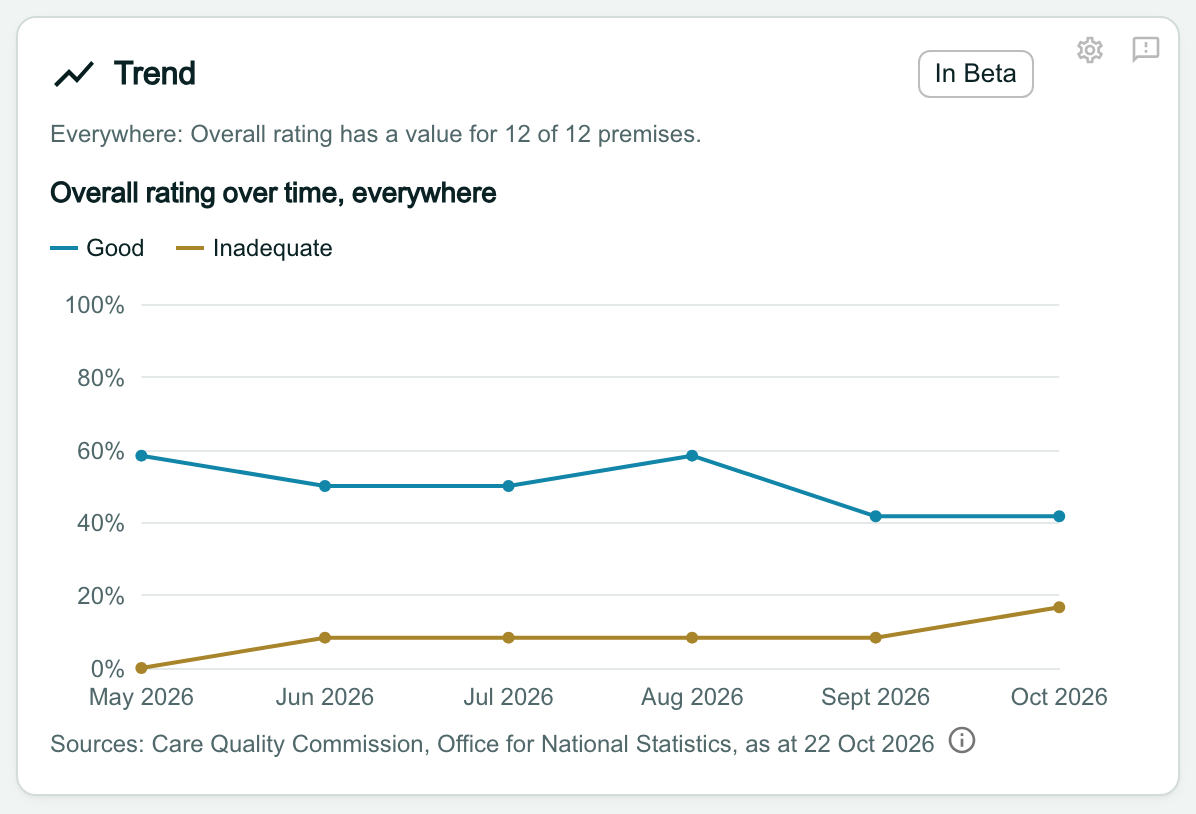
The Trend draws a point for each month end, with a key naming each line. The history behind it deepens month by month, so newer layers start with only a few points.

Note
When you click Export PDF above the dashboard, a Trend prints as a table, a row for each month and a column for each line. A chart set to Then and now prints both readings, today and as at the day.
The Trend card headed Overall rating over time, everywhere, with a key for Good and Inadequate. A line chart runs from May 2026 to Oct 2026 on a 0% to 100% scale: Good falls from about 58% to about 42%, and Inadequate rises from 0% to about 17%.

Split the trend by a group

Where a field can be split, a Split by choice appears beside the values. Choose a group, such as Service type, and click Apply.

Split, the Trend draws one value’s share, so you choose one value only.
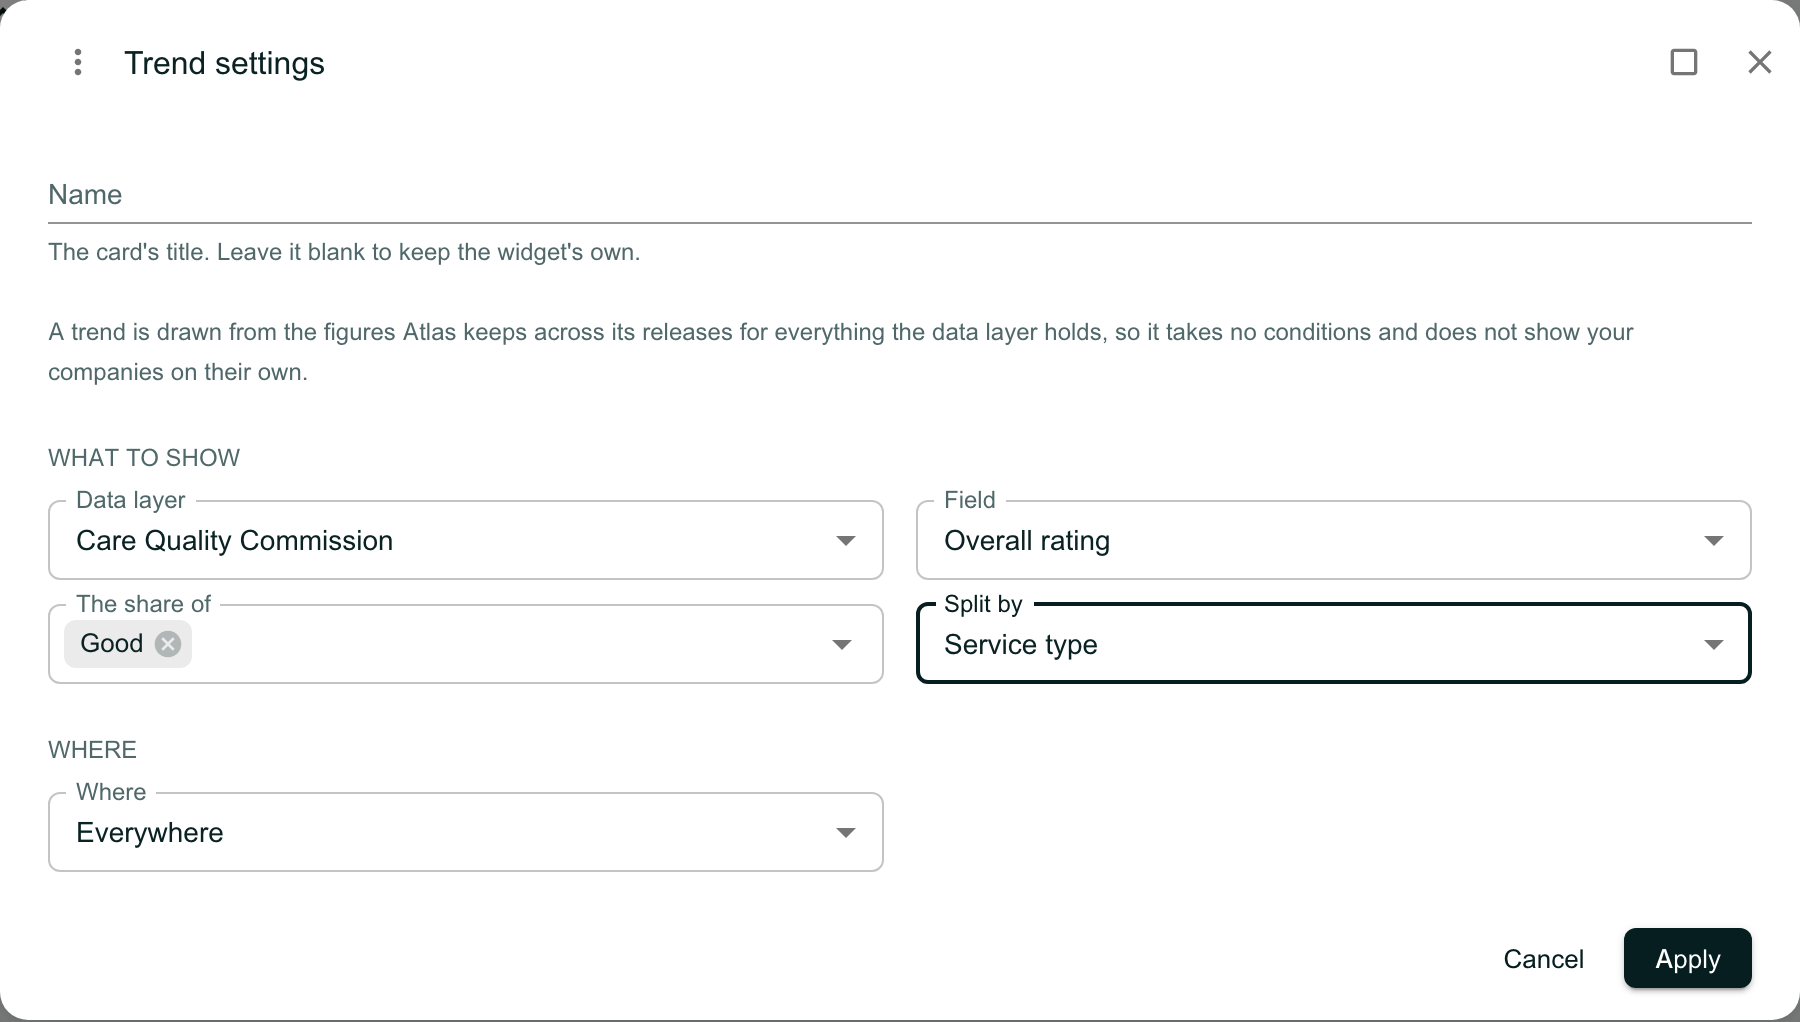
The Trend settings with Field Overall rating, The share of Good, and Split by set to Service type.

Read a split trend

The card draws a line for each group, the four largest, and the heading names the value and the split.
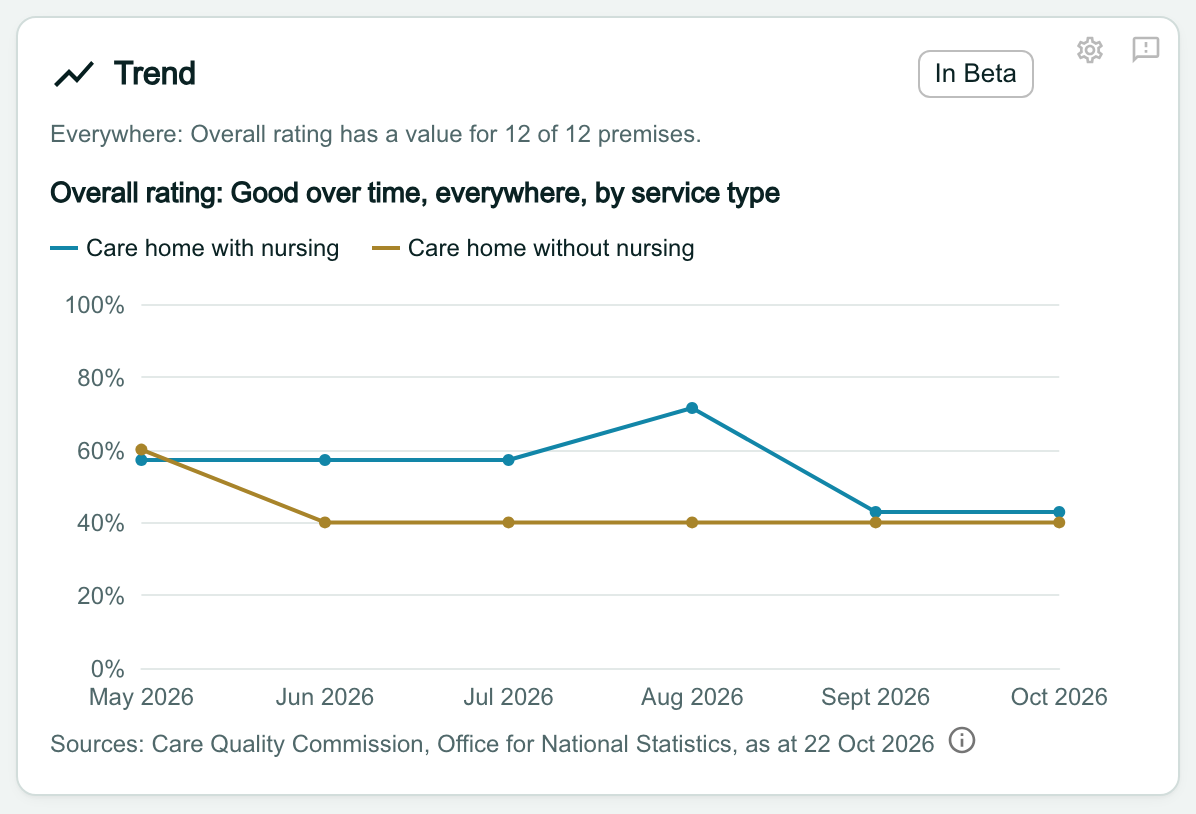
The Trend card headed Overall rating: Good over time, everywhere, by service type, with a line each for Care home with nursing and Care home without nursing, from May 2026 to Oct 2026.

Know why a Trend is not drawn

A Trend card can show a line of text in place of the chart:

  • Not enough history yet to draw a trend. There are fewer than two points so far. The trend appears as the months go by.
  • A note from the data service, shown as it sends it, such as Service type is not measured across releases, so it has no series. Choose another field or area in the settings.

A Trend over an area with fewer than 5 records is not drawn either, and says so.

Two Trend cards. The first, headed Average beds over time, everywhere, reads Not enough history yet to draw a trend. The second reads Service type is not measured across releases, so it has no series.