Data layers & Intelligence

Use the chart widgets: Portfolio, Intel and Comparison

7 min read
The chart widgets turn a data layer into figures on a dashboard: Headline figures, Breakdown, Cross-tab and the Map. Each can show your own companies, everything the data layer holds, or the two side by side. Here you name a widget, choose whose figures it shows, read a comparison and set up the Map. It takes about ten minutes.

Before you start

These widgets need a data layer switched on for your workspace (see Turn on a data layer), and a role that can see that layer. To add a widget to a dashboard, see Customise your Home dashboard: the chart widgets are in the Intelligence group under Ready-made in Add a widget. Build a chart, at the top of the same window, adds them already set to the chart you pick: see Build a chart widget.

Note

The companies and figures in these pictures are examples made up for this guide, over a handful of invented records. They are not real statistics. The fields you can choose depend on the data layers your workspace has switched on.

Find the chart widgets on a dashboard

Open a dashboard that holds chart widgets. Each card has a gear icon at its top right, an In Beta label, a line saying how many records have a value, and a Sources line with the date the figures are as at.

Here every widget shows Everywhere: all the records the data layer holds, not only your companies.
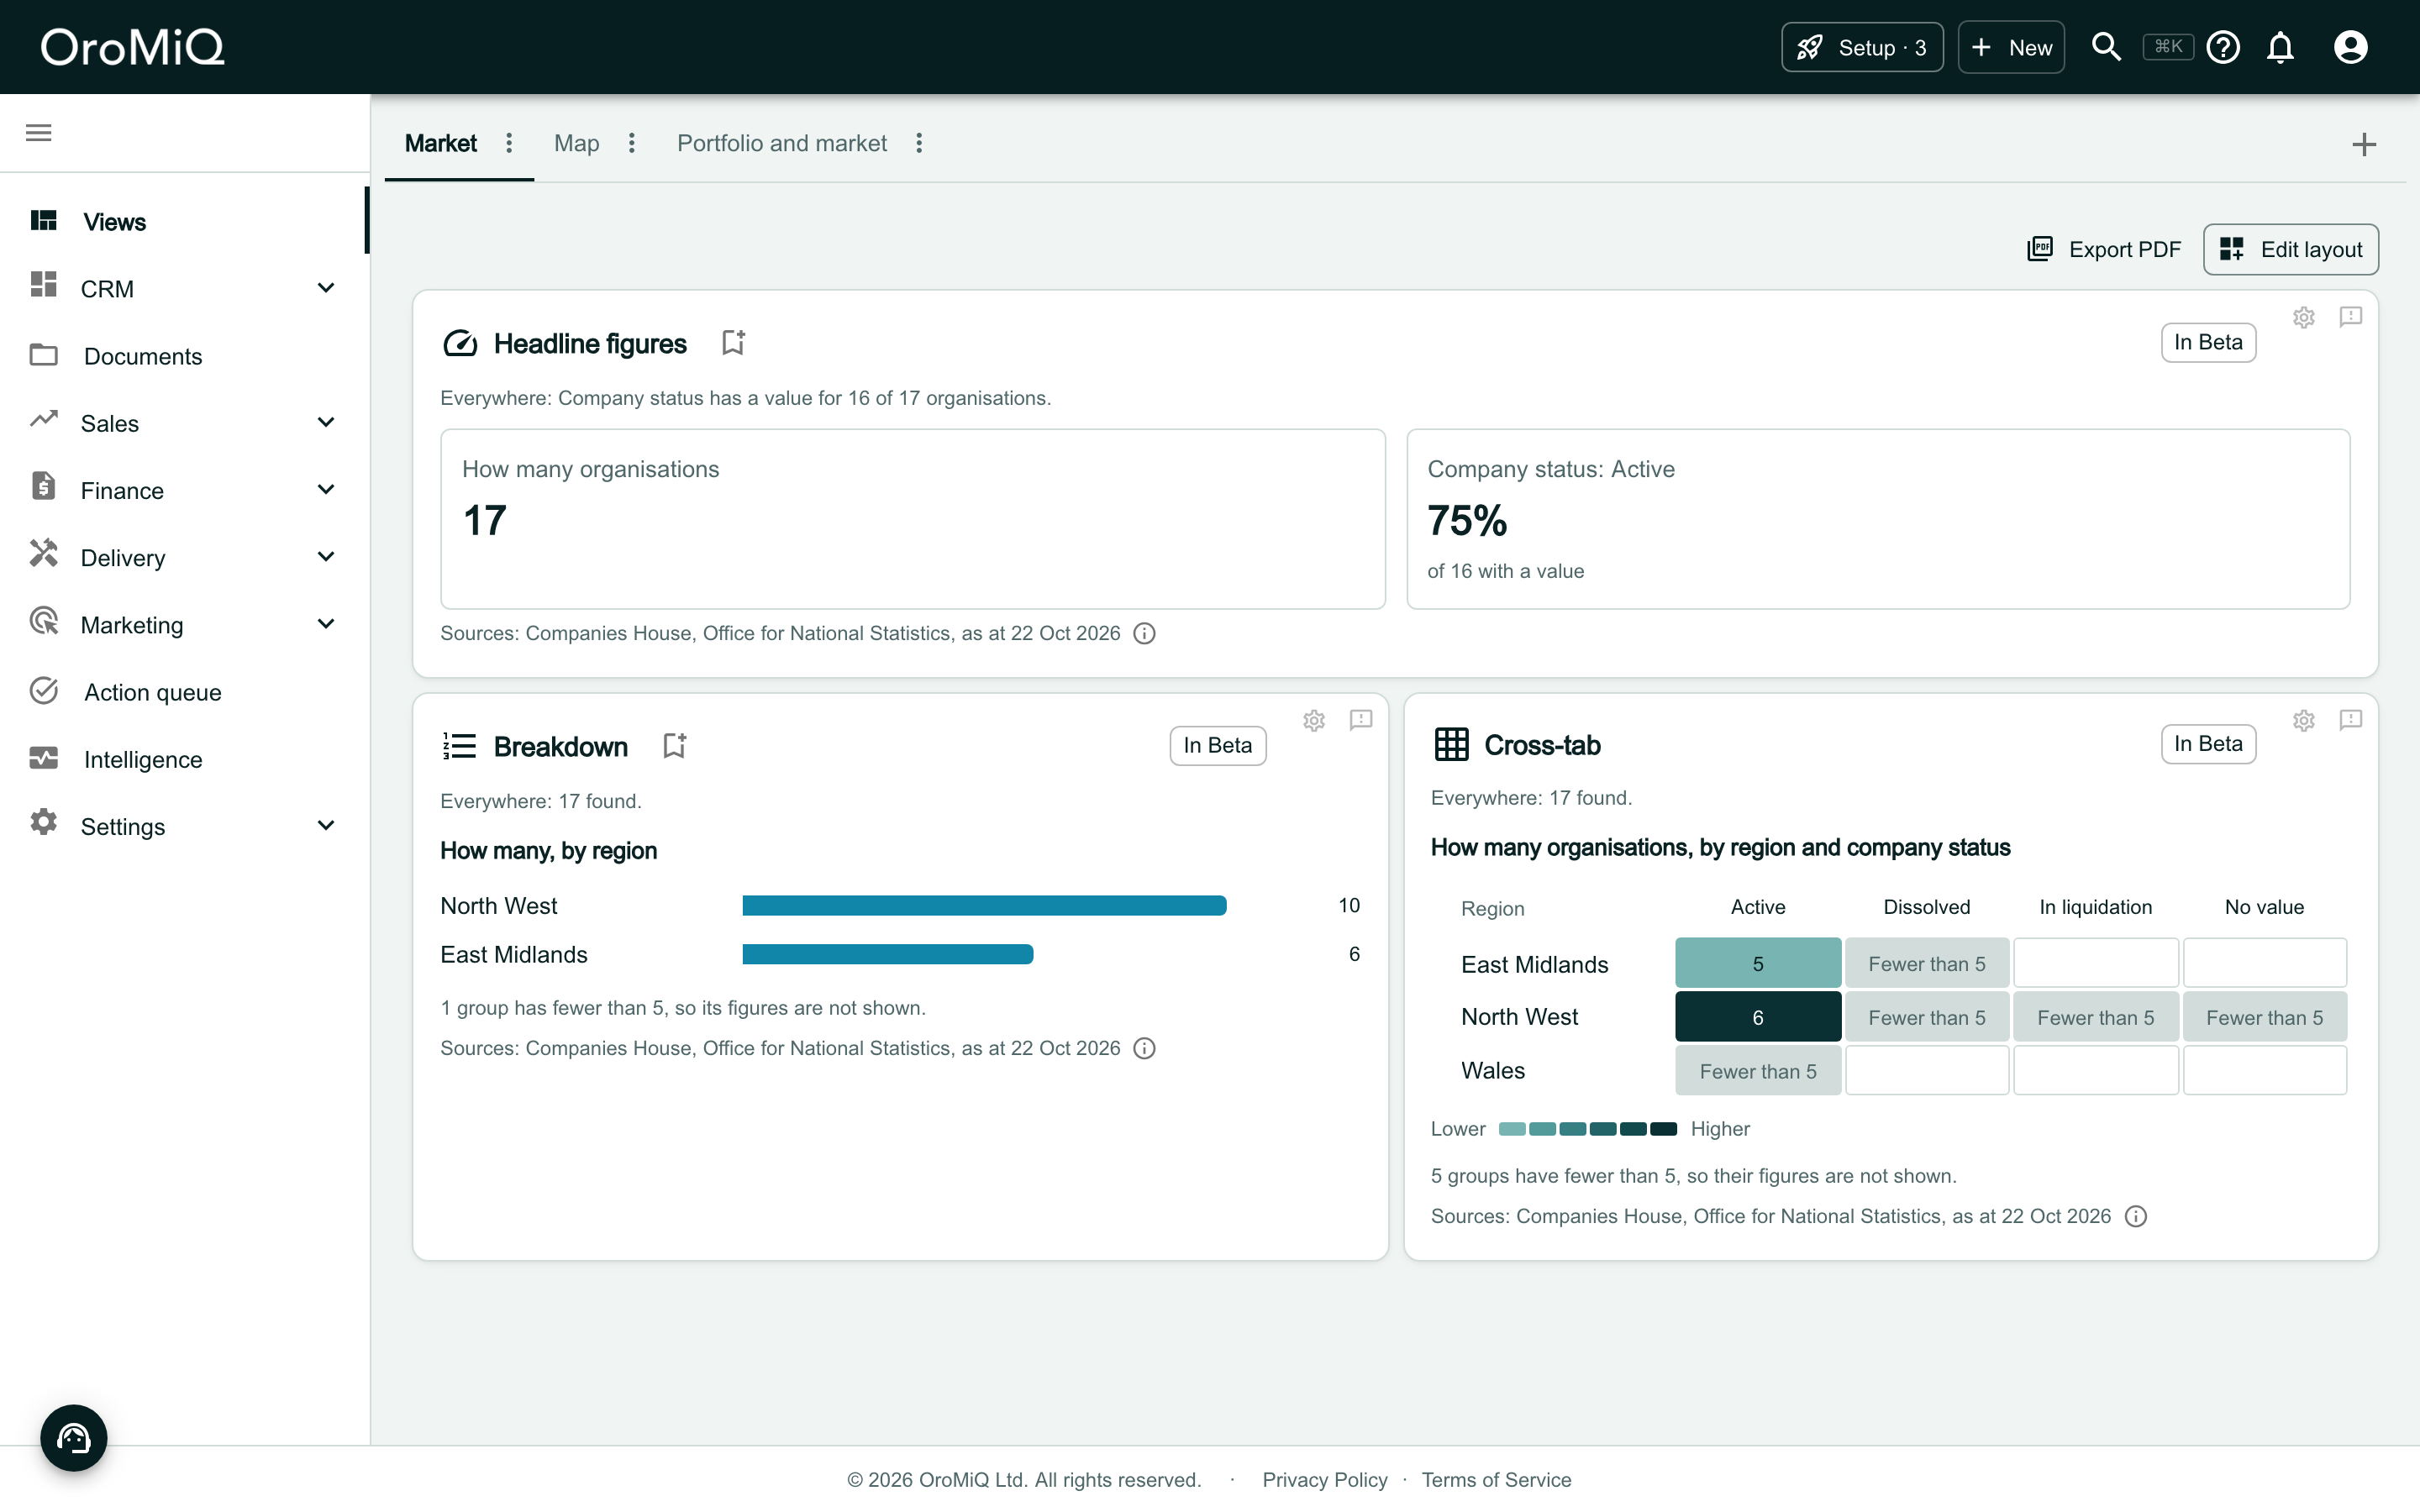
A dashboard tab called Market in Views, with Export PDF and Edit layout at the top. Headline figures shows How many organisations 17 and Company status: Active 75% of 16 with a value. Below, Breakdown shows How many, by region with bars for North West 10 and East Midlands 6, and Cross-tab shows How many organisations, by region and company status as a shaded grid. Each card is labelled In Beta, has a gear icon at its top right and ends with a Sources line.

Open a widget's settings

Click the gear icon on the card. Every dashboard widget’s settings start with a Name: the card’s title. The chart widgets then have What to show, Whose figures and Conditions.
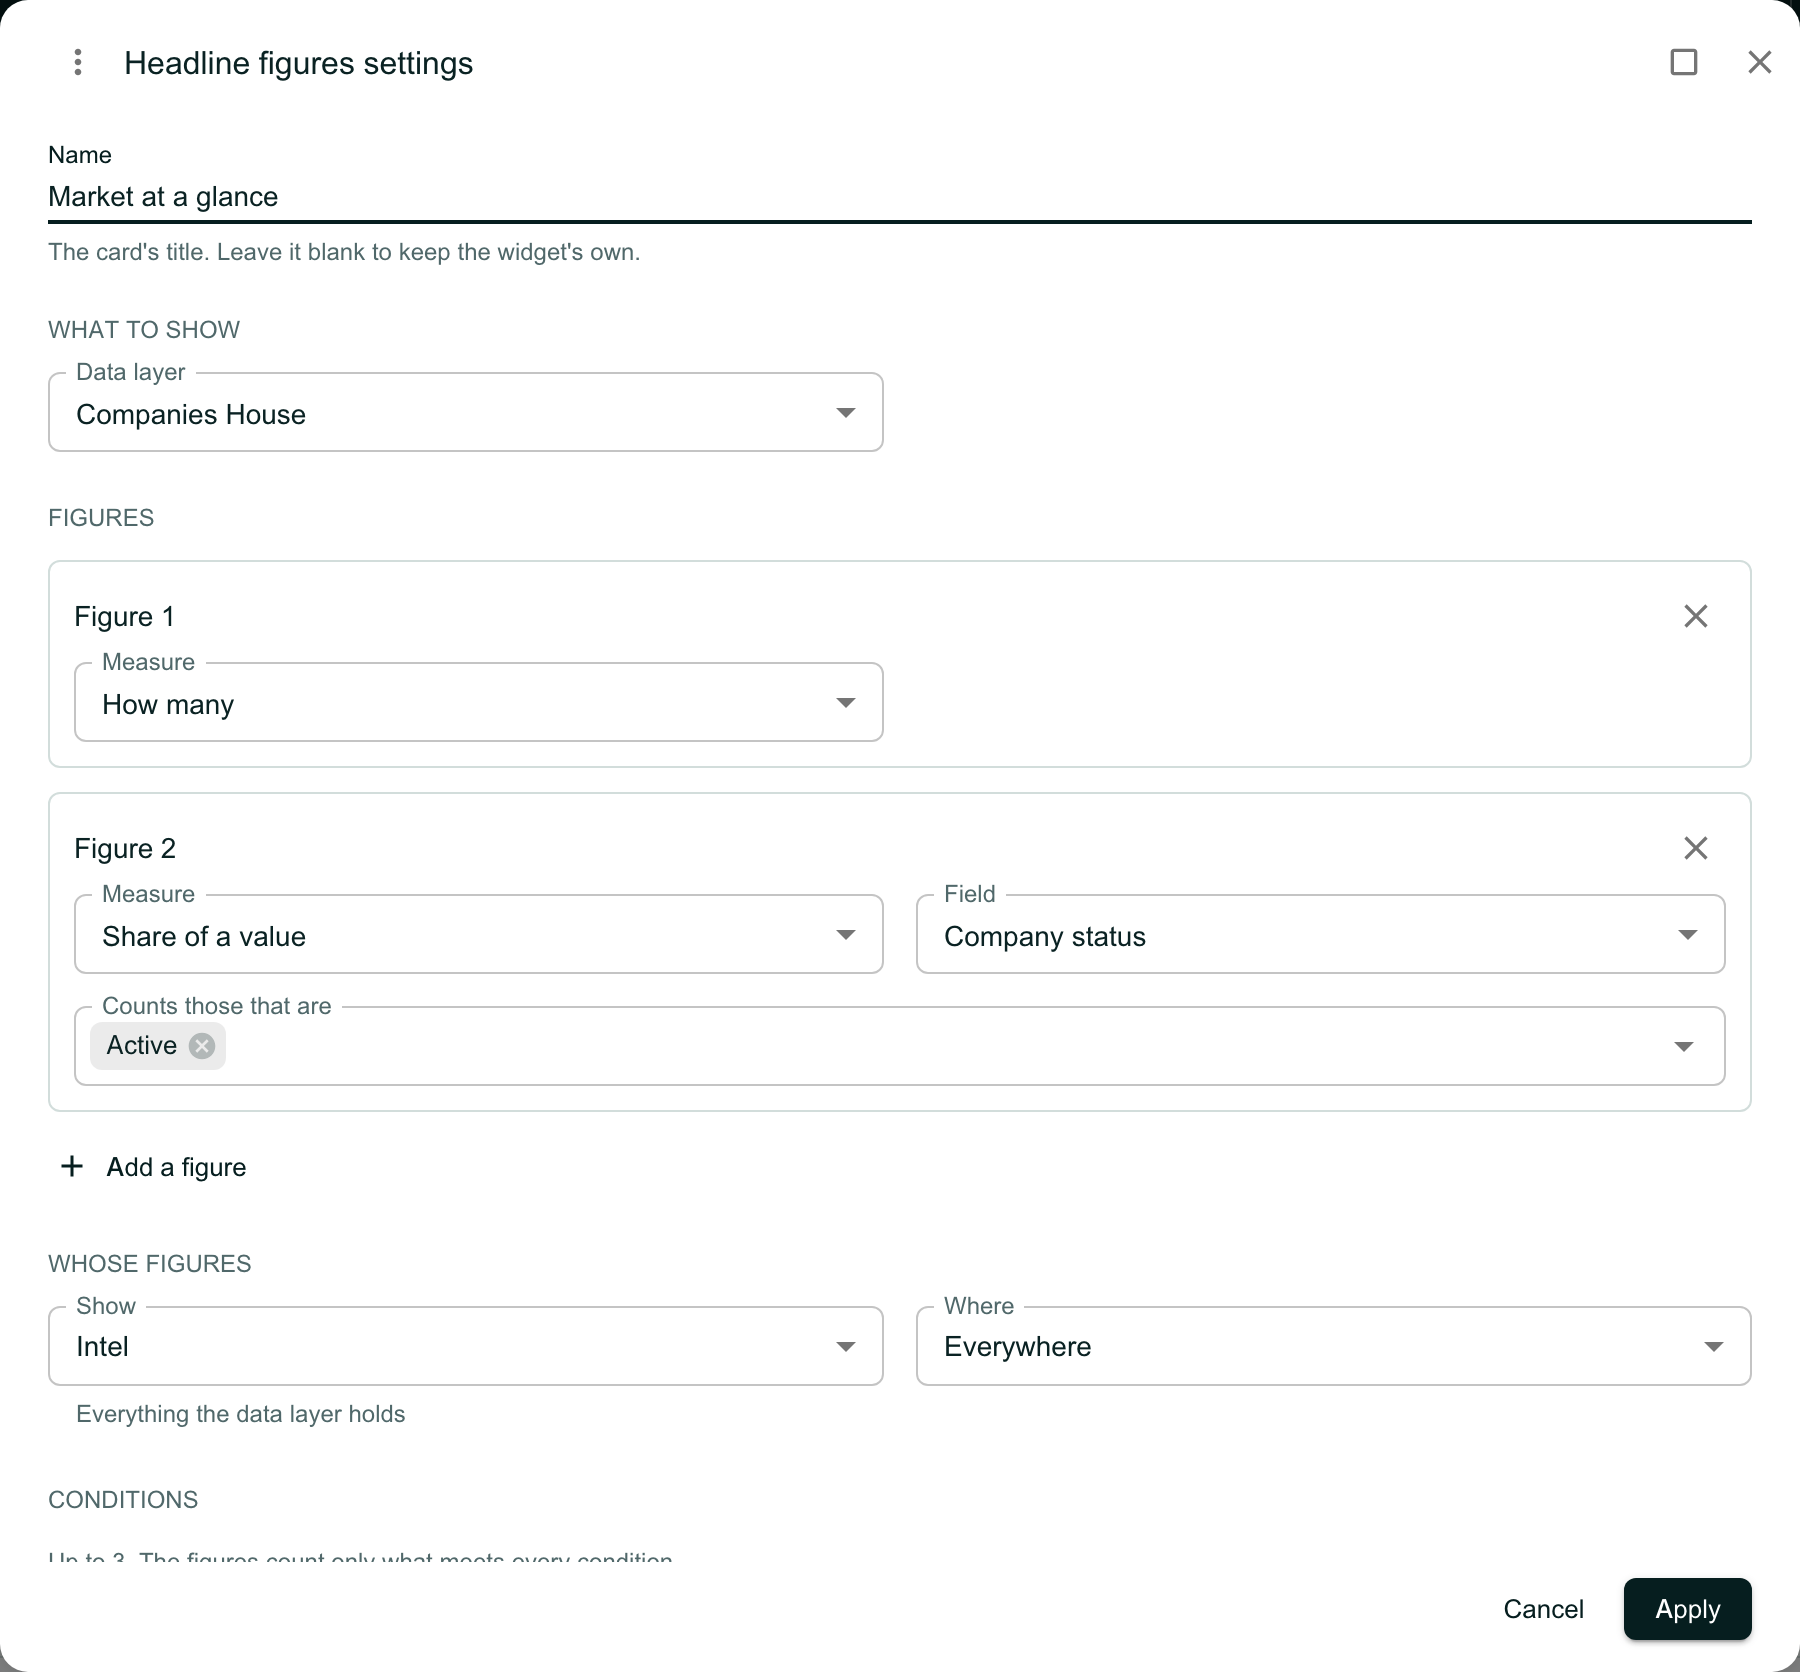
The Headline figures settings dialog. Name is filled in as Market at a glance, with the line The card’s title. Leave it blank to keep the widget’s own. Below are What to show with Data layer Companies House, Figures with Figure 1 How many and Figure 2 Share of a value for Company status counting those that are Active, Add a figure, then Whose figures with Show set to Intel and Where set to Everywhere, then Conditions, with Cancel and Apply.

Give the card a name

Type a Name and click Apply. The card shows it as its title, and the same name is used when you save the widget as a report, in the list of widgets to choose from, and in the dashboard’s PDF.

Leave Name blank to keep the widget’s own title.
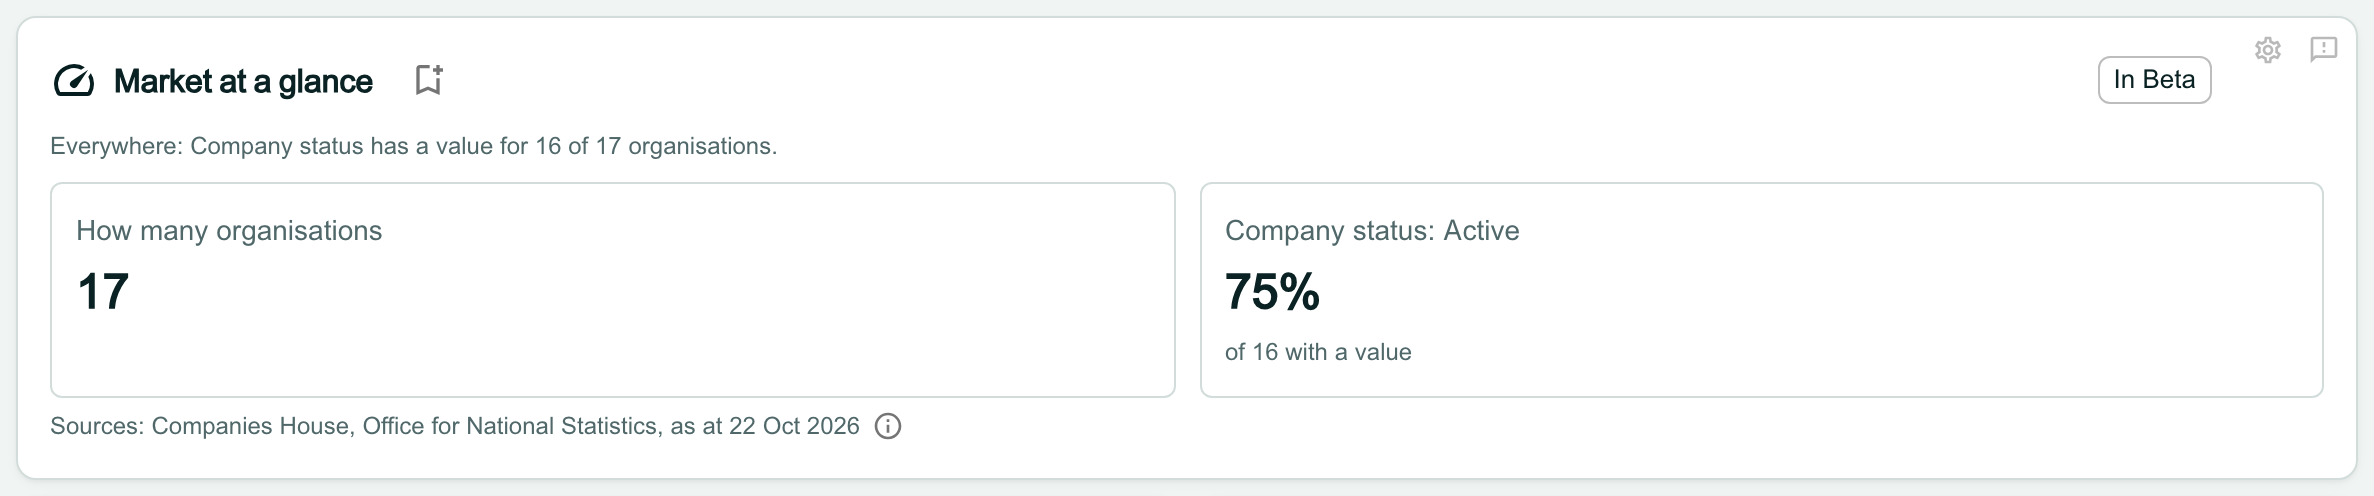
The Headline figures card now titled Market at a glance, with its figures How many organisations 17 and Company status: Active 75%.

Choose whose figures to show

Headline figures, Breakdown, Cross-tab and the Map each make one choice under Whose figures. Open Show and choose:

  • Portfolio: your companies only. These are the companies linked to a register record in this data layer.
  • Intel: everything the data layer holds that meets the widget’s conditions. Use Where for everywhere or one area.
  • Comparison: your companies against the data layer, side by side.

Click Apply to save the choice.
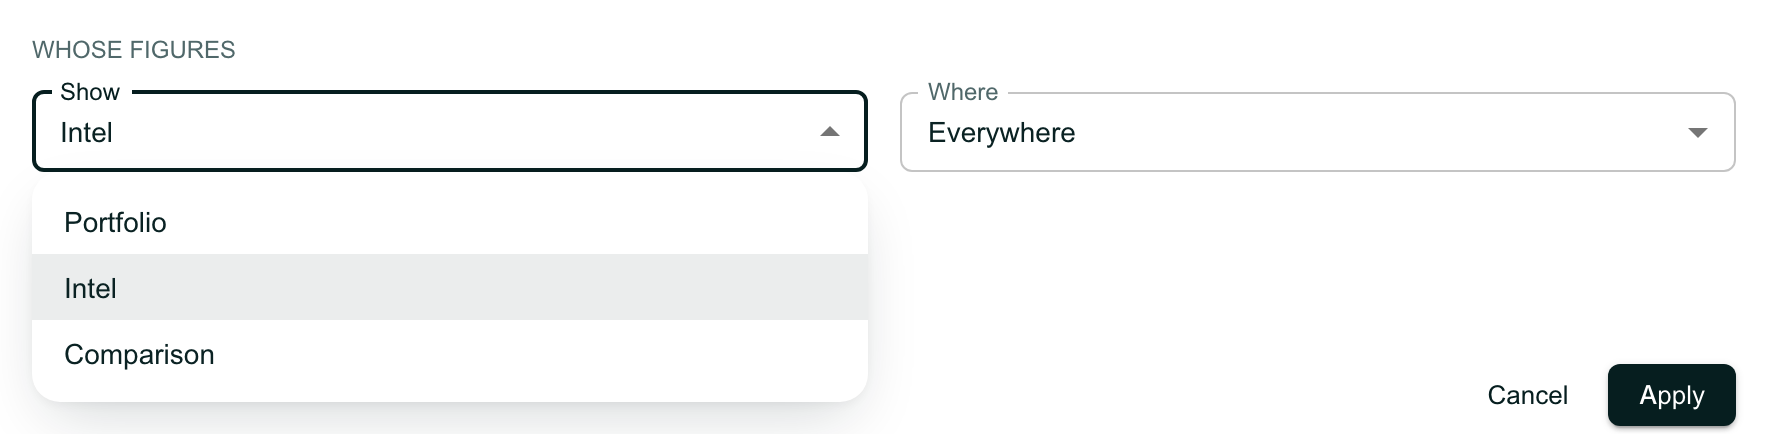
The Whose figures section of a widget’s settings, with the Show choice open listing Portfolio, Intel and Comparison, and Where set to Everywhere beside it.

Read a comparison

With Comparison, each widget shows your companies beside the data layer. A line at the top of each card says how many records each side counts.

When the figure is a count, the comparison shows the share of the data layer that your companies make up, such as 6 of 17 (35.3% of those found everywhere), rather than two counts side by side.
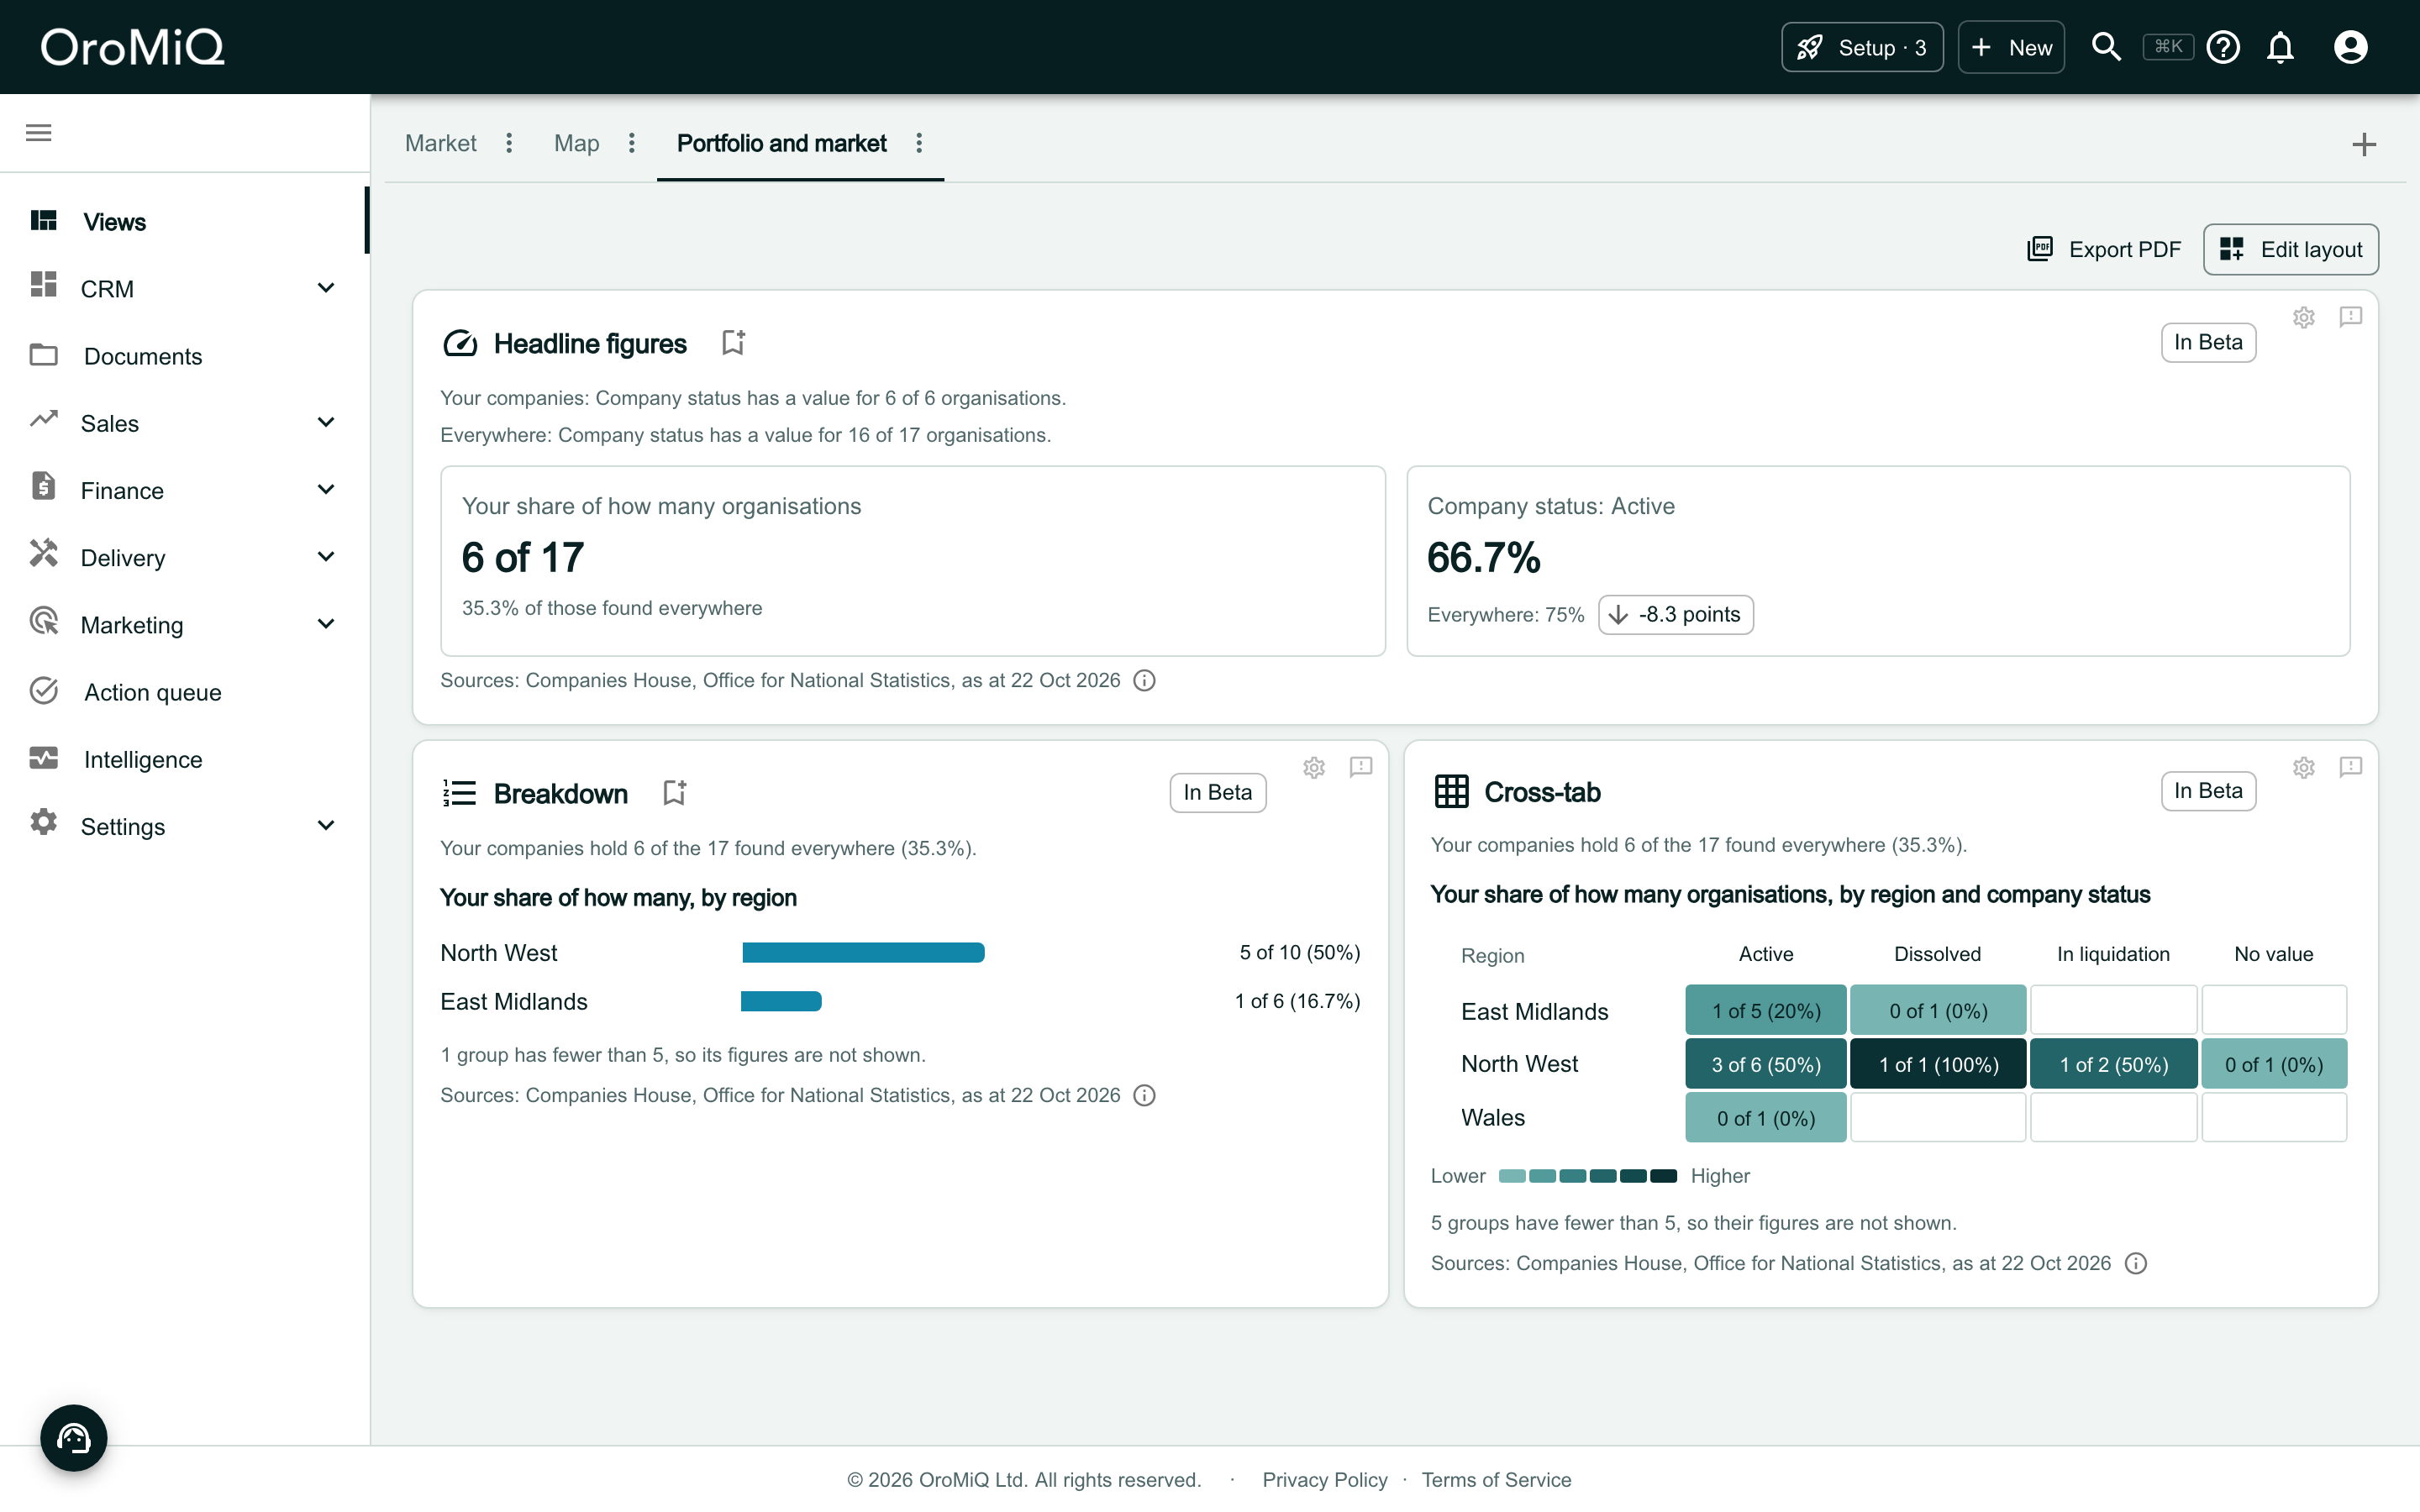
A dashboard tab called Portfolio and market with the same three widgets set to Comparison. Headline figures shows Your share of how many organisations 6 of 17 and Company status: Active 66.7% against Everywhere: 75%. Breakdown shows Your share of how many, by region, and Cross-tab shows Your share of how many organisations, by region and company status.

Headline figures, compared

Each tile leads with your companies’ figure. The data layer’s figure sits beneath it, with the difference in points: here 66.7% of your companies are active, against 75% everywhere, so -8.3 points.
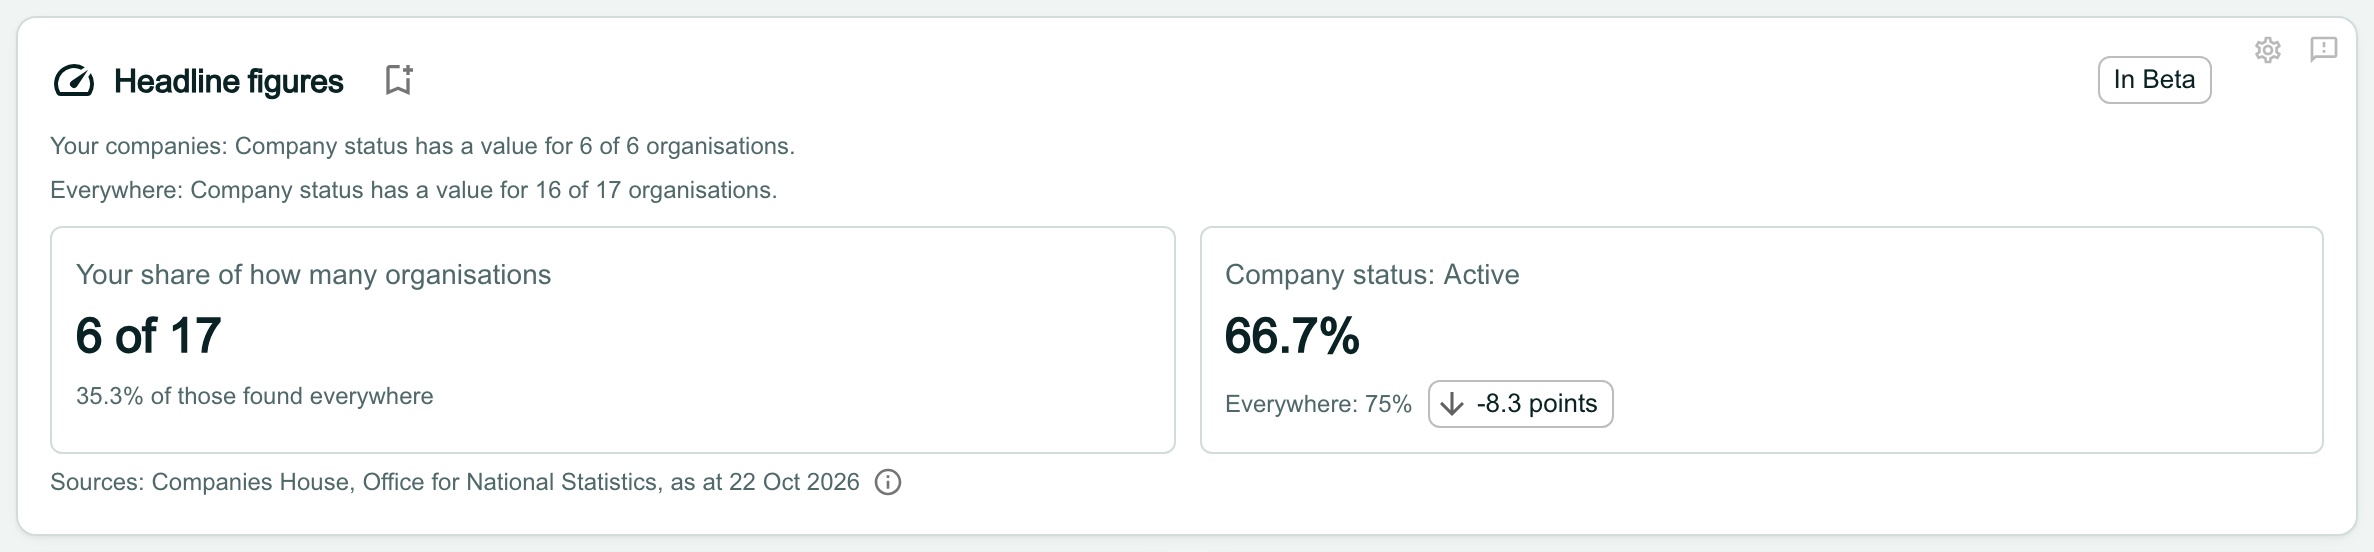
Headline figures compared. The lines read Your companies: Company status has a value for 6 of 6 organisations and Everywhere: Company status has a value for 16 of 17 organisations. One tile reads Your share of how many organisations, 6 of 17, 35.3% of those found everywhere. The other reads Company status: Active, 66.7%, Everywhere: 75%, with a chip reading -8.3 points.

Breakdown, compared

Counting, the Breakdown shows the share of each group your companies make up, such as North West 5 of 10 (50%). For any other figure, such as a share or an average, it draws a pair of bars for each group: yours first, then the data layer’s, with a key.
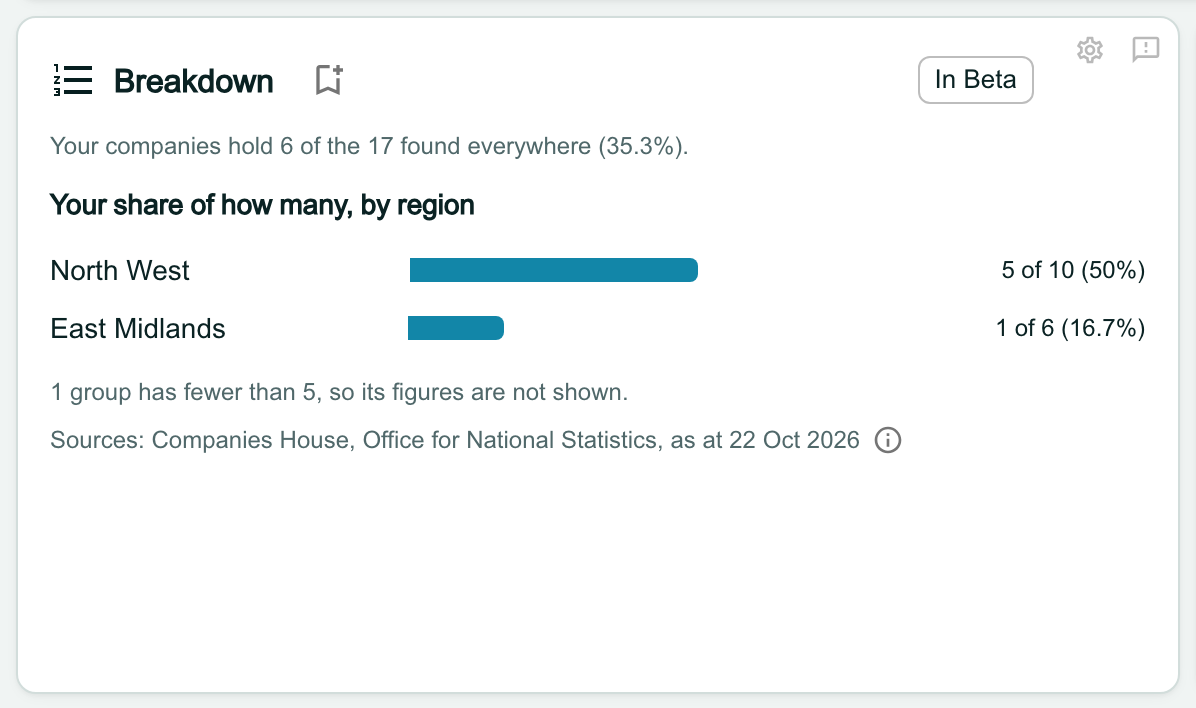
Breakdown compared, counting. The line reads Your companies hold 6 of the 17 found everywhere (35.3%). Under Your share of how many, by region, North West has a bar and 5 of 10 (50%), and East Midlands 1 of 6 (16.7%). Below: 1 group has fewer than 5, so its figures are not shown.

Cross-tab, compared

Counting, the Cross-tab is one grid of the share your companies hold in each pair, shaded from Lower to Higher. For any other figure it draws your grid beside the data layer’s, on the same rows, columns and colours (one under the other on a narrow card).
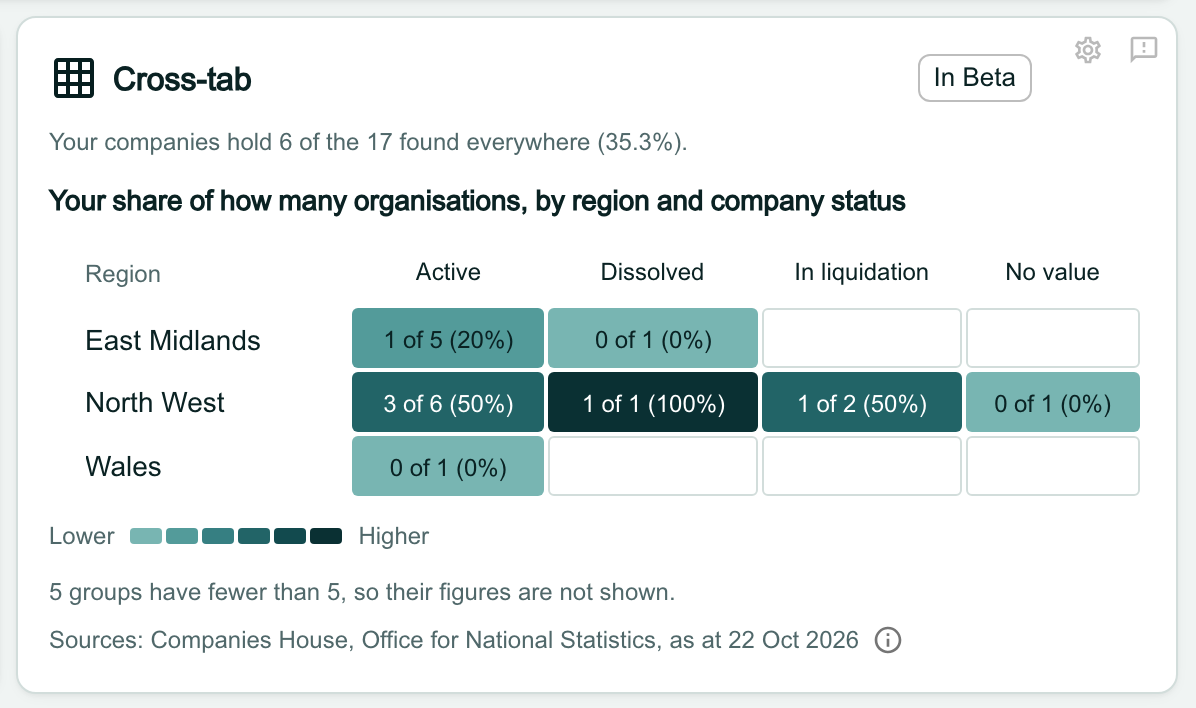
Cross-tab compared, counting: Your share of how many organisations, by region and company status. A grid has rows East Midlands, North West and Wales and columns Active, Dissolved, In liquidation and No value, with cells such as 3 of 6 (50%) and 1 of 1 (100%), shaded on a Lower to Higher scale. Below: 5 groups have fewer than 5, so their figures are not shown.

Keep a small portfolio readable

A group of fewer than 5 records shows how many it holds but no figures, and each widget says how many groups it held back. If you hold a few dozen companies, splitting them by local authority leaves most groups under 5.

The settings warn you when you choose a grouping finer than a region. A small portfolio reads best by region, or as Headline figures.

The Whose figures section of a Breakdown’s settings with Show set to Comparison and Where set to Everywhere, and the line Groups under 5 show no figures, so a small portfolio reads best by region.

Read the Map, compared

Compared, the Map draws two maps on one colour scale: your companies first, then the data layer. Click a region to see its local authorities, and hover over an area for its figure.

The legend explains the greys:

  • None (the deeper grey): nothing was counted in that area.
  • Fewer than 5, or no data for this area (the pale grey): the figure is held back.
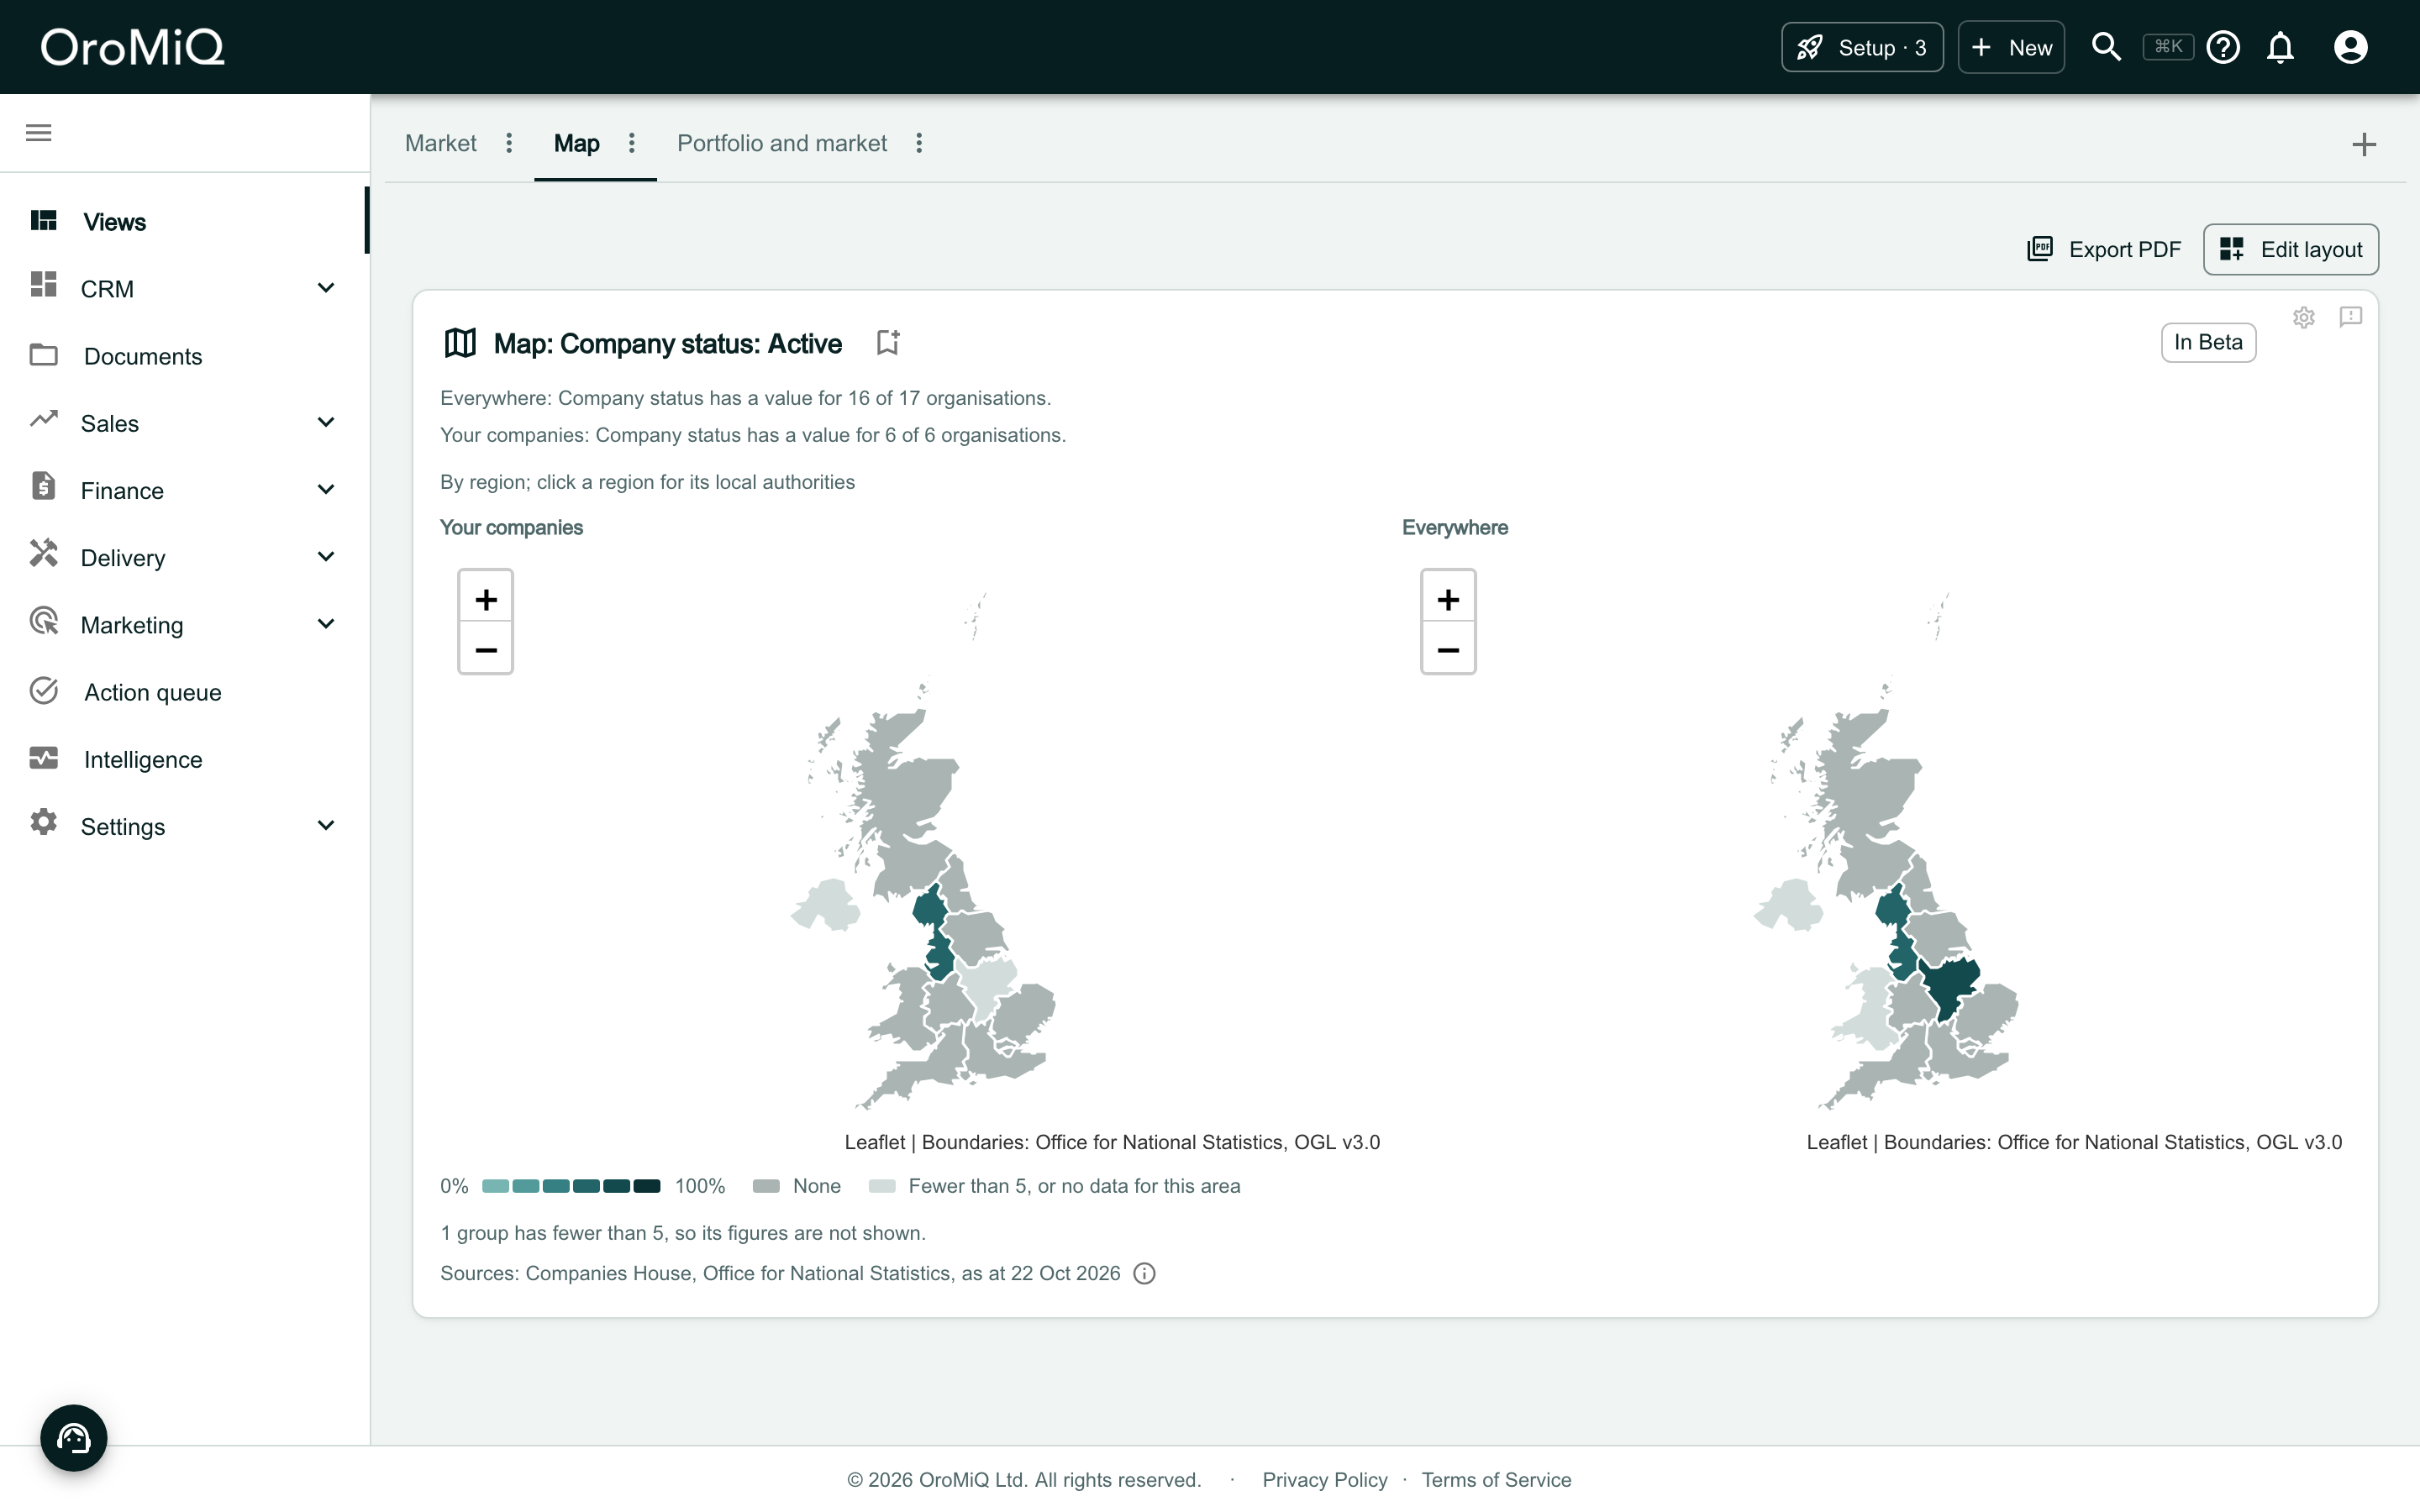
A dashboard tab called Map with one widget, Map: Company status: Active, set to Comparison. Two maps of the UK sit side by side, Your companies on the left and Everywhere on the right, with regions shaded teal by share. A legend under them reads 0% to 100%, None in a mid grey, and Fewer than 5, or no data for this area in a pale grey.

Choose the values the Map colours by

Open the Map’s settings. With Measure set to Share of a value, choose a Field, then tick one or more Values. The Map colours each area by the share that has any of them.
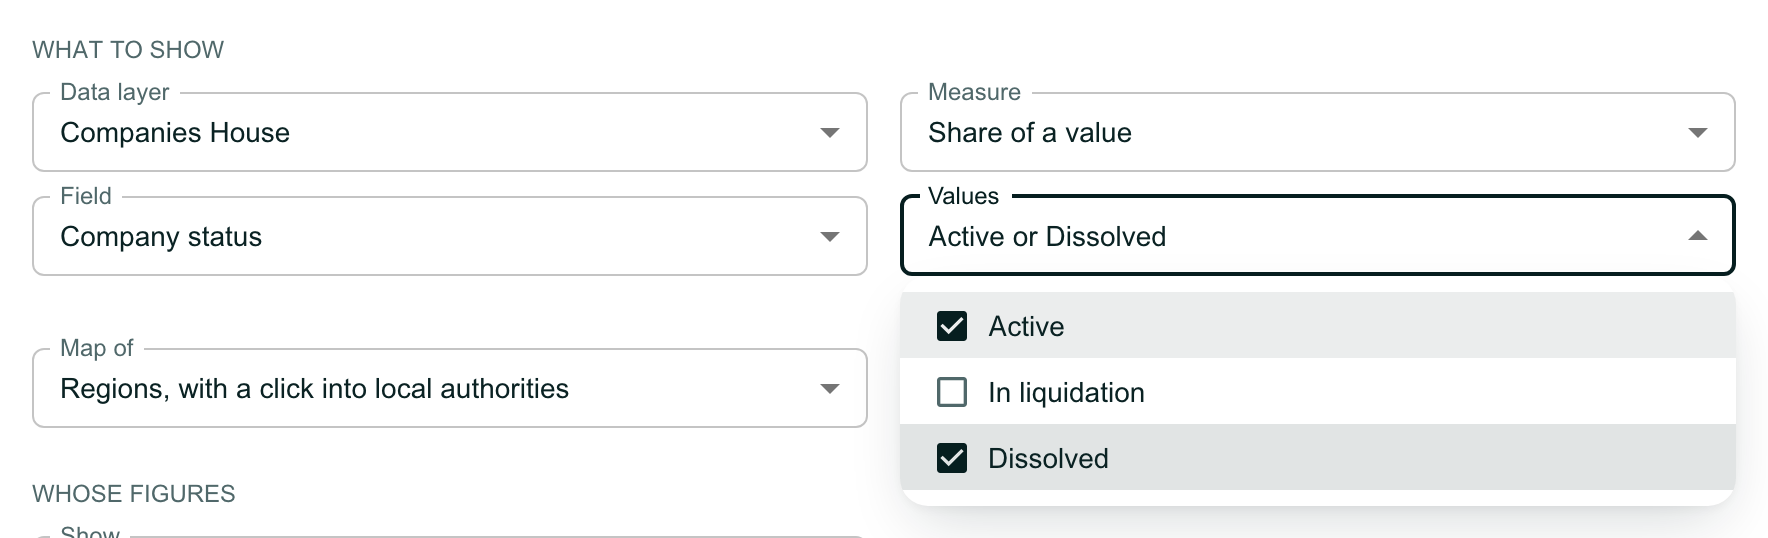
The What to show section of the Map’s settings: Data layer Companies House, Measure Share of a value, Field Company status, and Values open with Active and Dissolved ticked and In liquidation not ticked. The Values box reads Active or Dissolved. Map of is set to Regions, with a click into local authorities.

Apply the Map's settings

Leave Values empty to colour by how many records have a value at all, rather than by a share. Map of chooses whether the Map opens on the UK’s regions or on England’s integrated care boards. Click Apply.
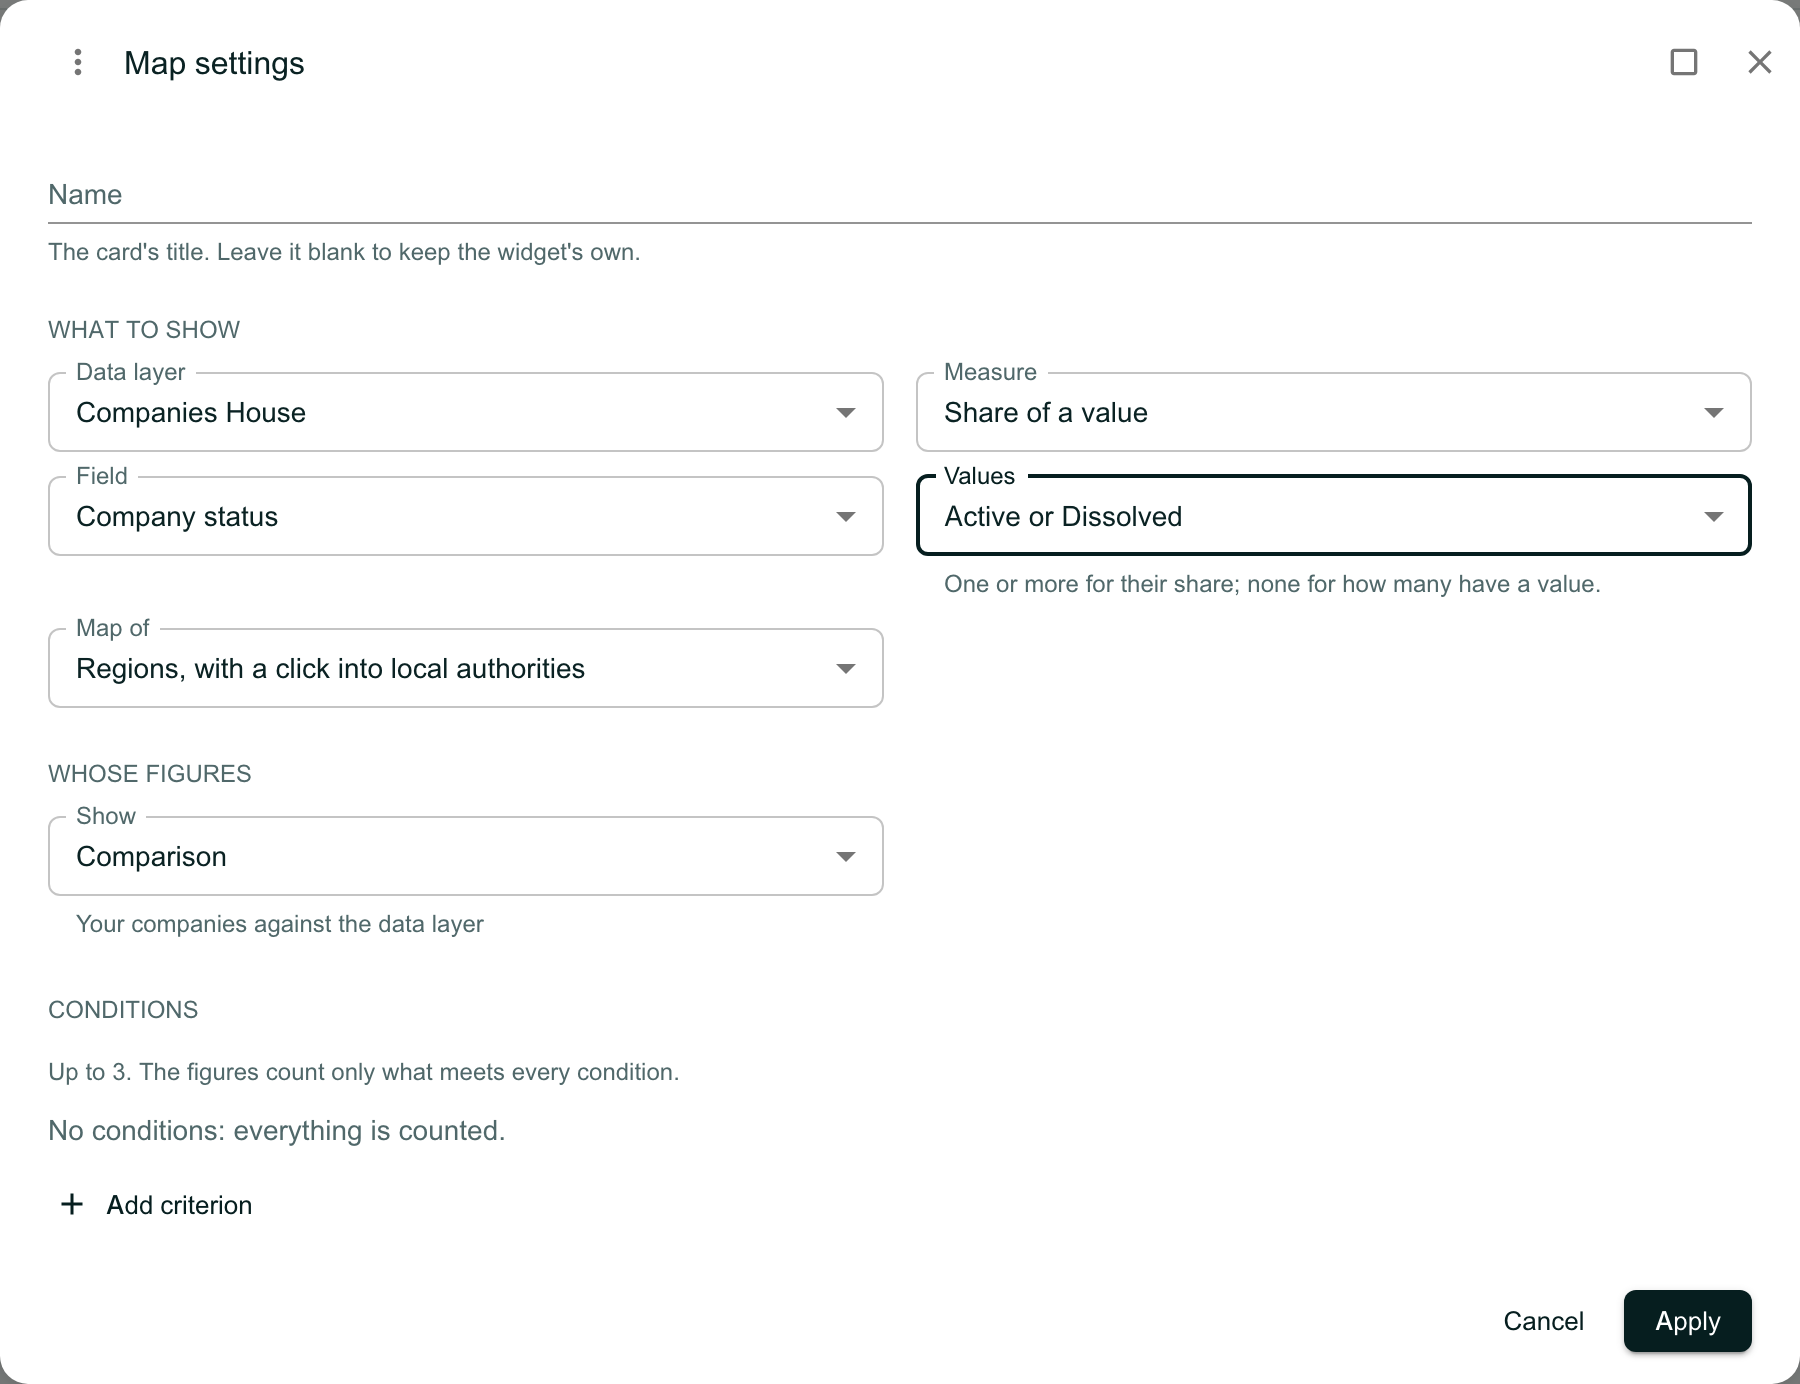
The Map settings dialog with Name blank, Data layer Companies House, Measure Share of a value, Field Company status, Values Active or Dissolved with the line One or more for their share; none for how many have a value, Map of Regions, with a click into local authorities, Show set to Comparison, and Conditions saying No conditions: everything is counted, with Cancel and Apply.

Read several values at once

With more than one value chosen, a row of chips appears above the map. Any of these is selected first and shows the combined share.

Hover over an area: the tooltip names the values and the base, such as North West: Active or Dissolved 77.8% (7 of 9 with a value). A share worked out from fewer than 5 records with a value is held back in pale grey.
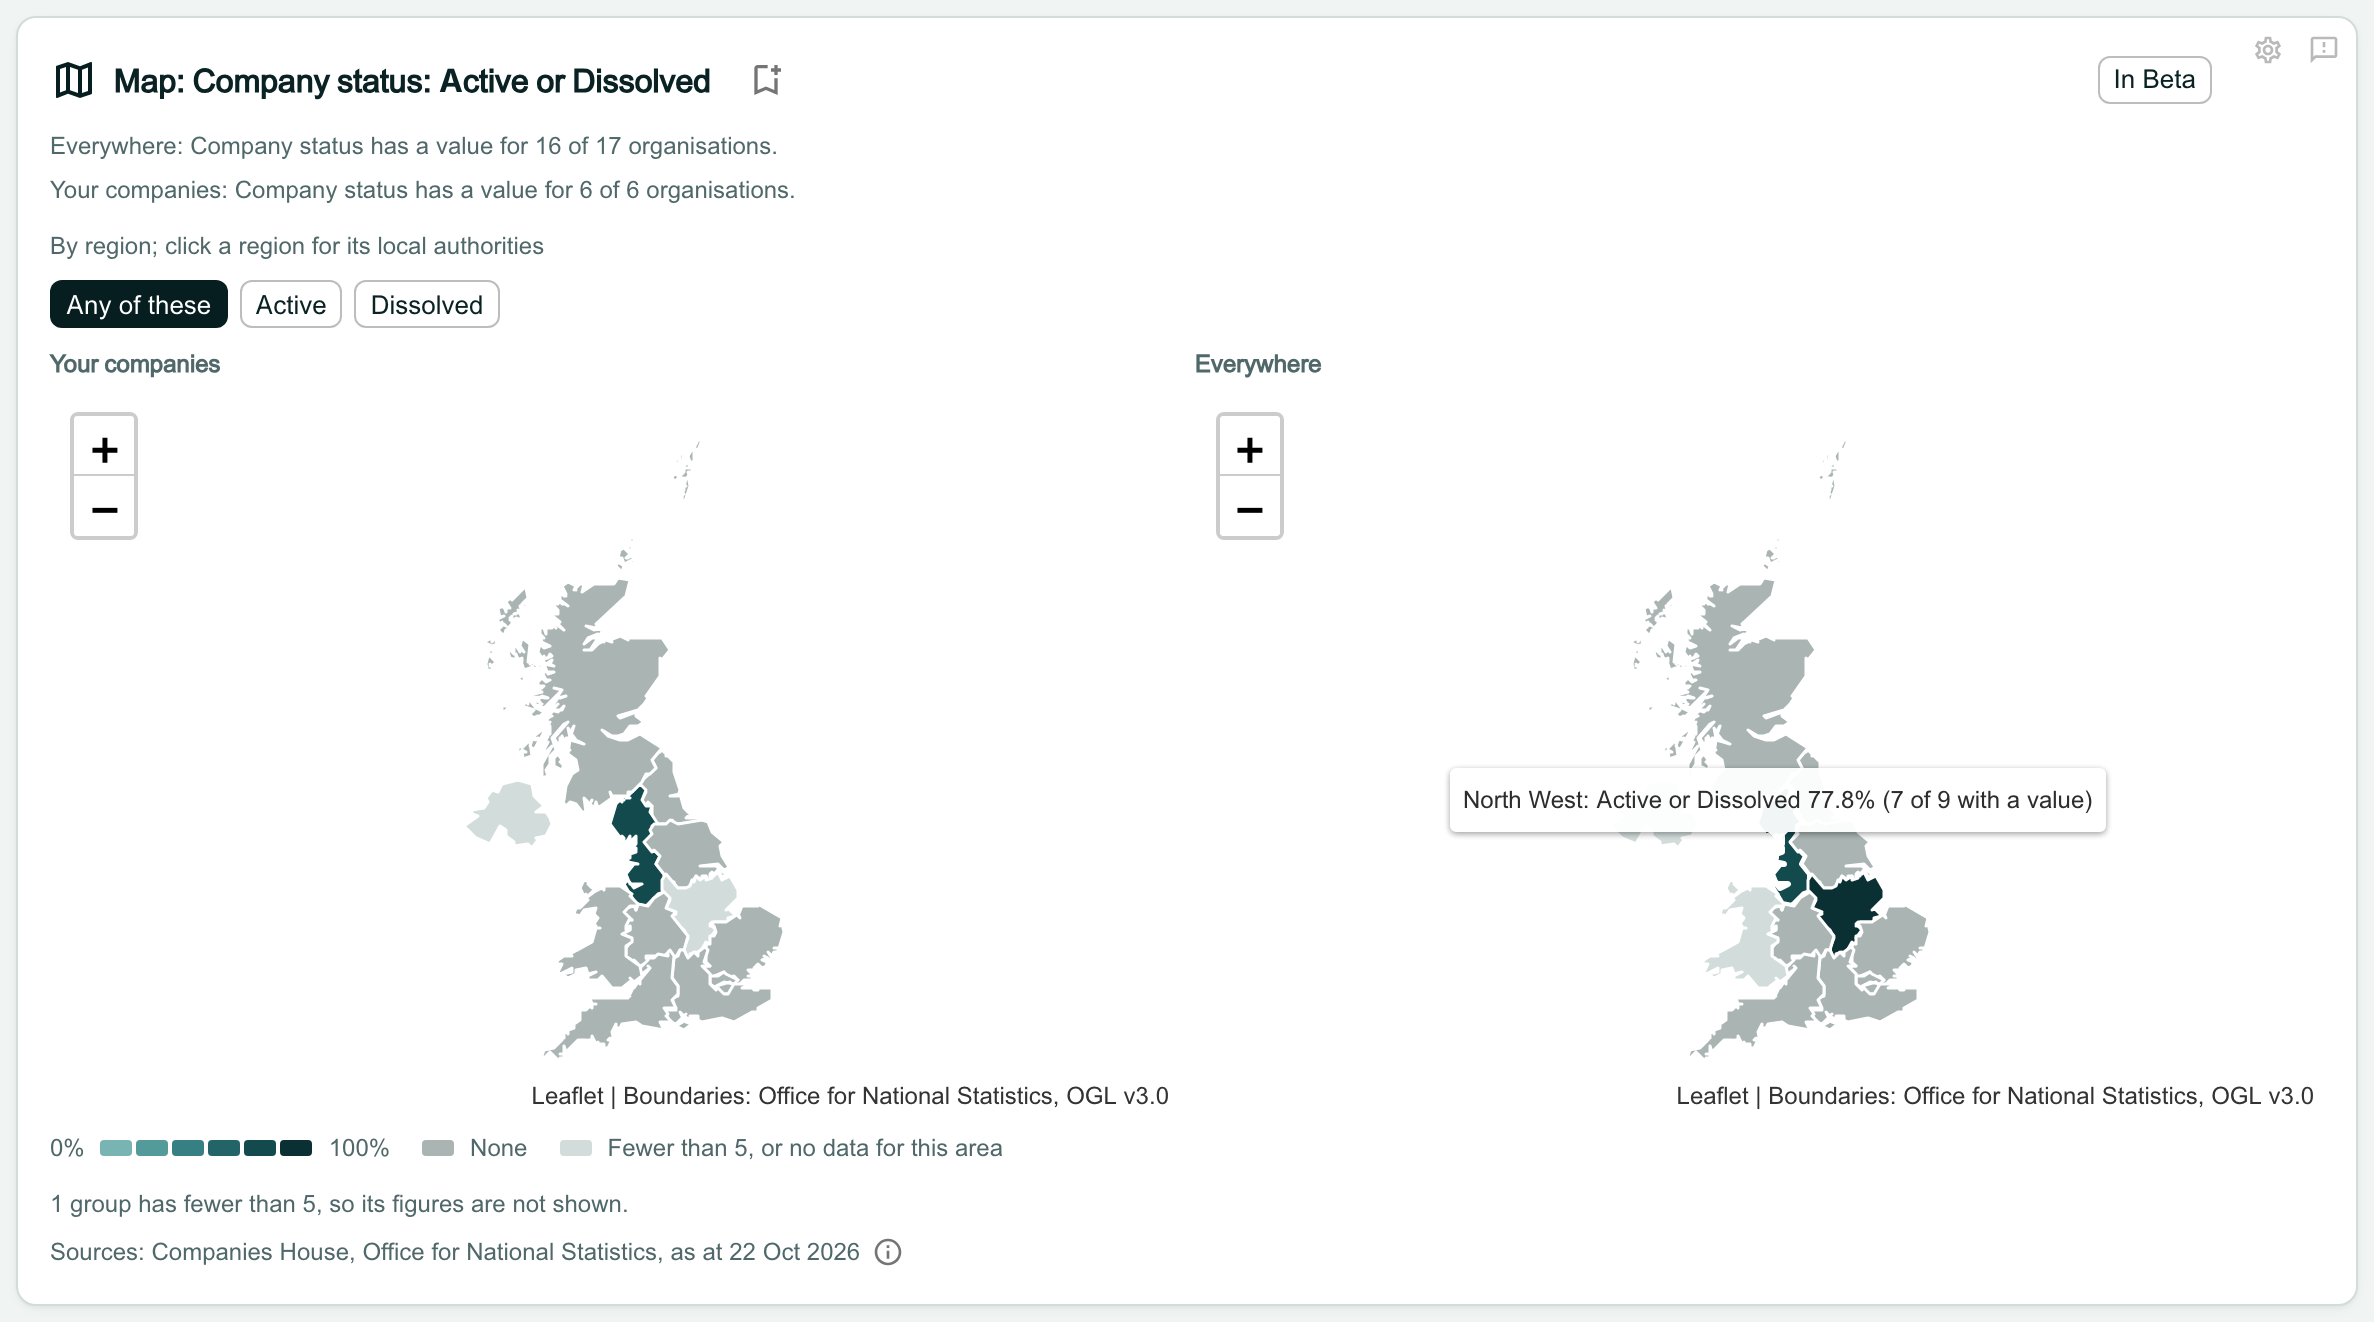
The Map widget titled Map: Company status: Active or Dissolved, with a row of chips reading Any of these (selected), Active and Dissolved above the two maps. A tooltip over the North West on the Everywhere map reads North West: Active or Dissolved 77.8% (7 of 9 with a value).

Look at one value on its own

Click a value’s chip to redraw both maps, the tooltips and the area panel for that value alone. This only changes what you are looking at; it is not saved, and the Map opens on Any of these next time.

Note
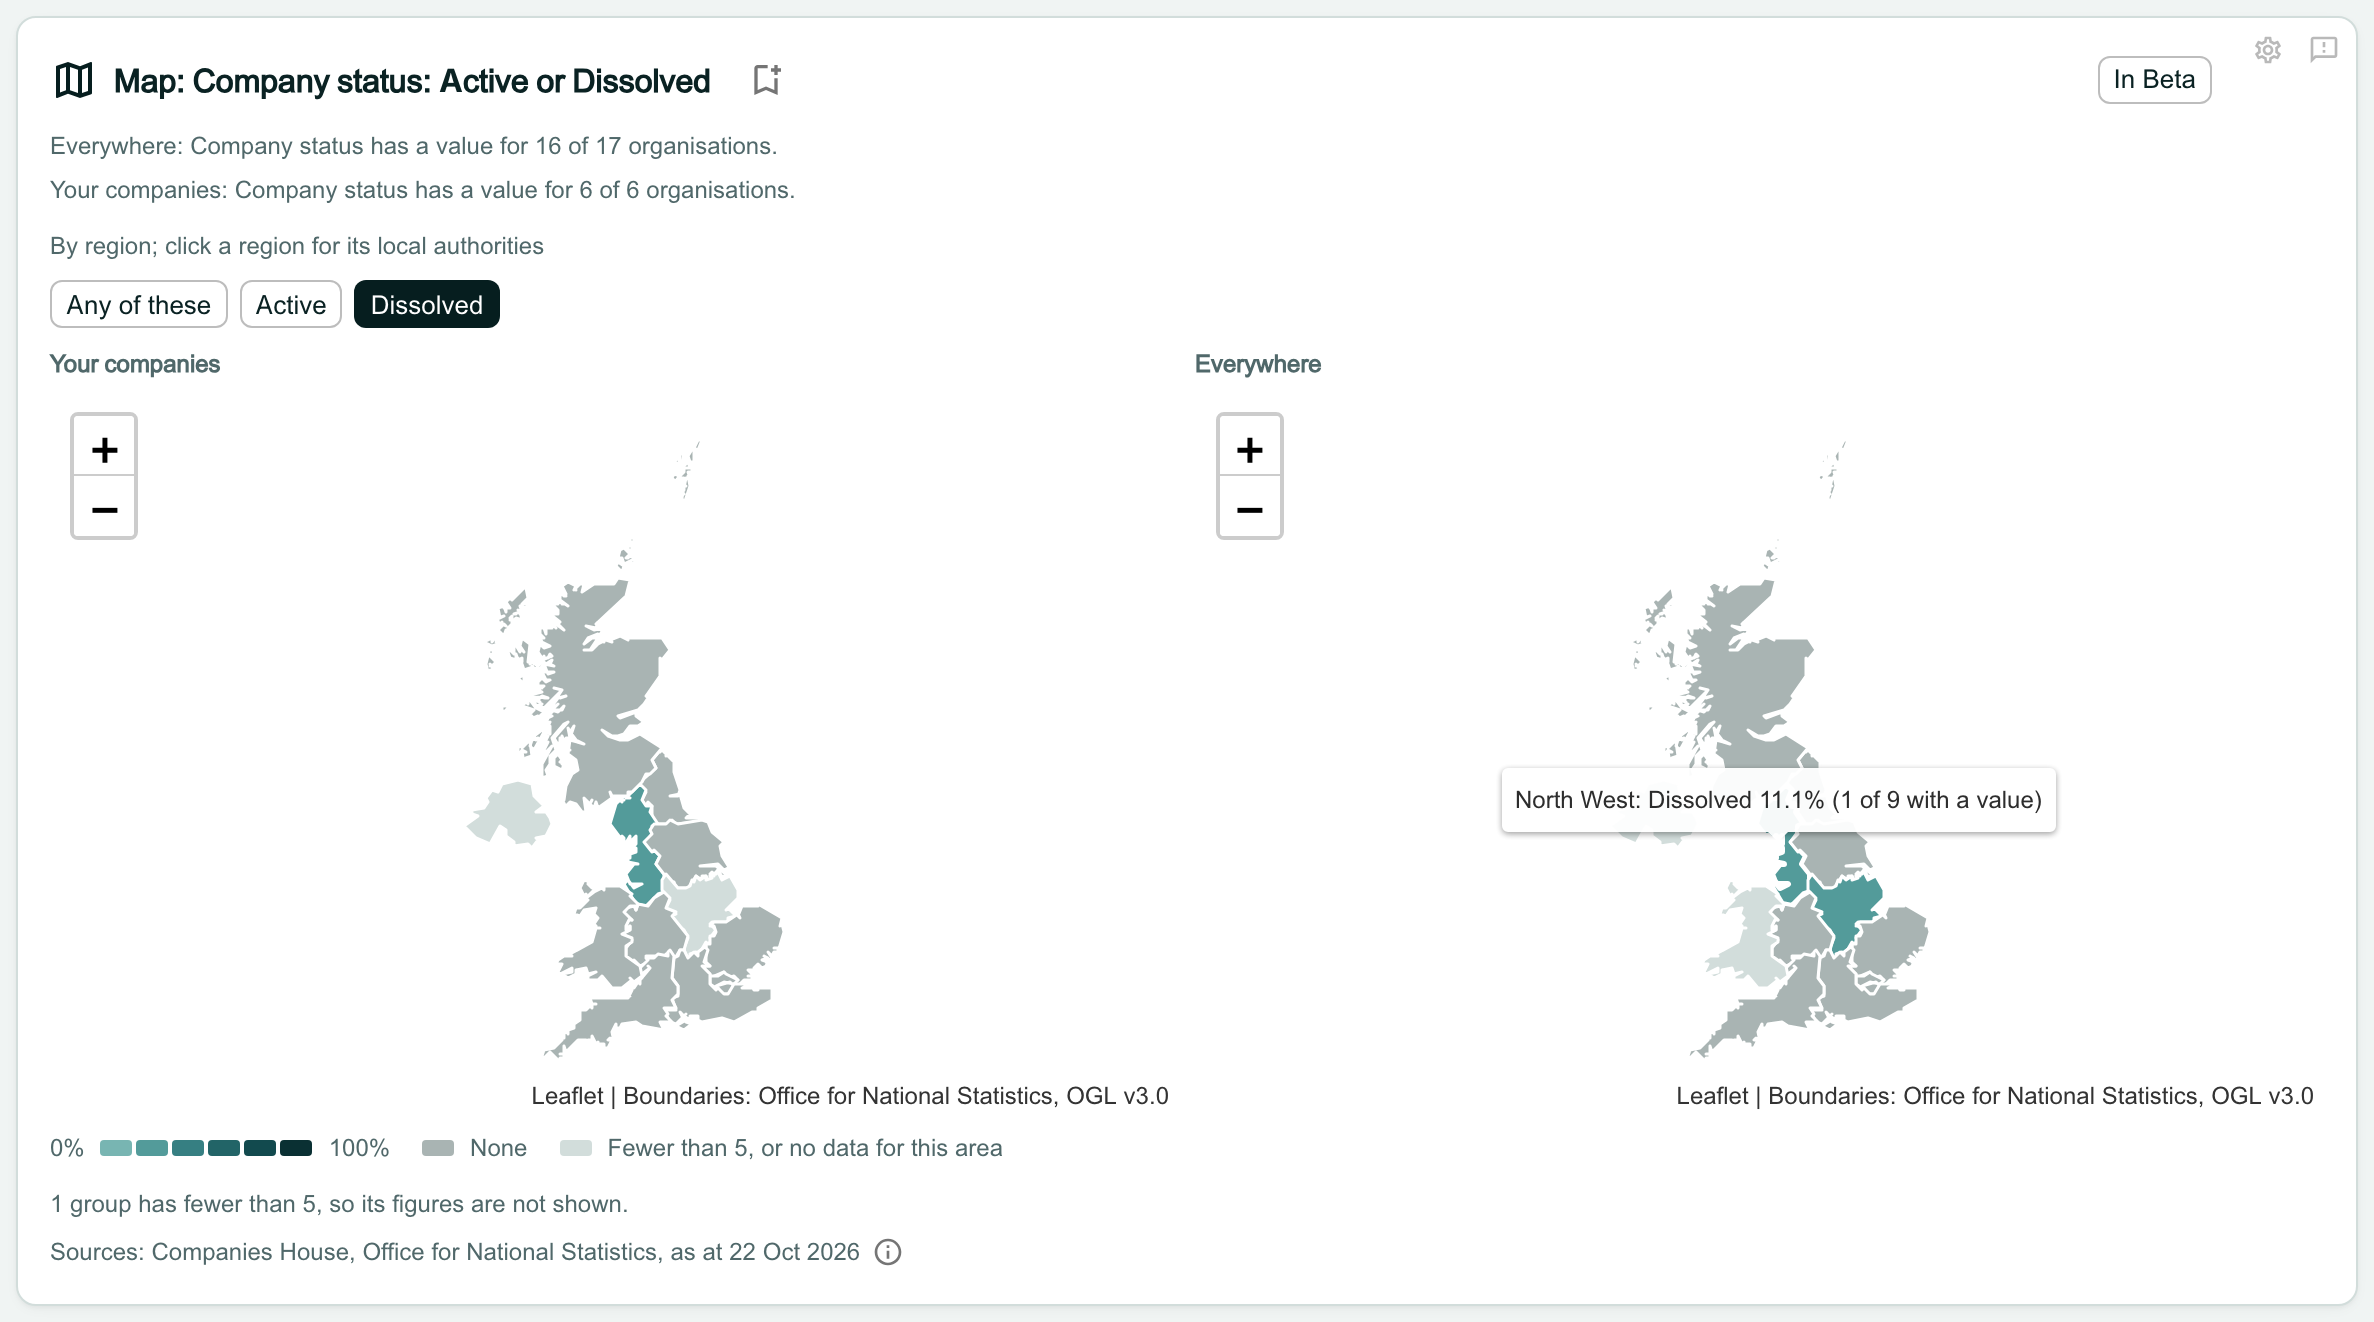
When you click Export PDF above the dashboard, the Map’s table prints a column for each value, then the combined one.
The same Map with the Dissolved chip selected. Both maps are redrawn in lighter teal, and the tooltip over the North West reads North West: Dissolved 11.1% (1 of 9 with a value).

Save your layout before you leave

Changes made in Edit layout are saved only when you click Done. If you open another tab or page first, OroMiQ asks:

  • Stay: go back to your edit.
  • Leave without saving: drop the changes and go.
  • Save and leave: save the layout, then go.
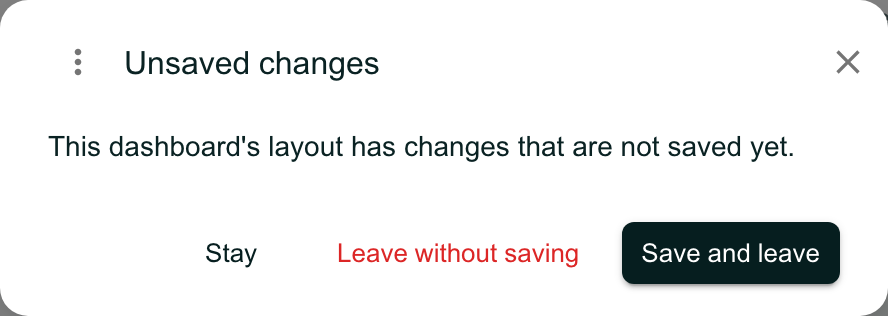
The Unsaved changes dialog: This dashboard’s layout has changes that are not saved yet, with the buttons Stay, Leave without saving and Save and leave.