Data layers & Intelligence
Add the Spread and Compare widgets to a dashboard
Before you start
Note
Create a dashboard
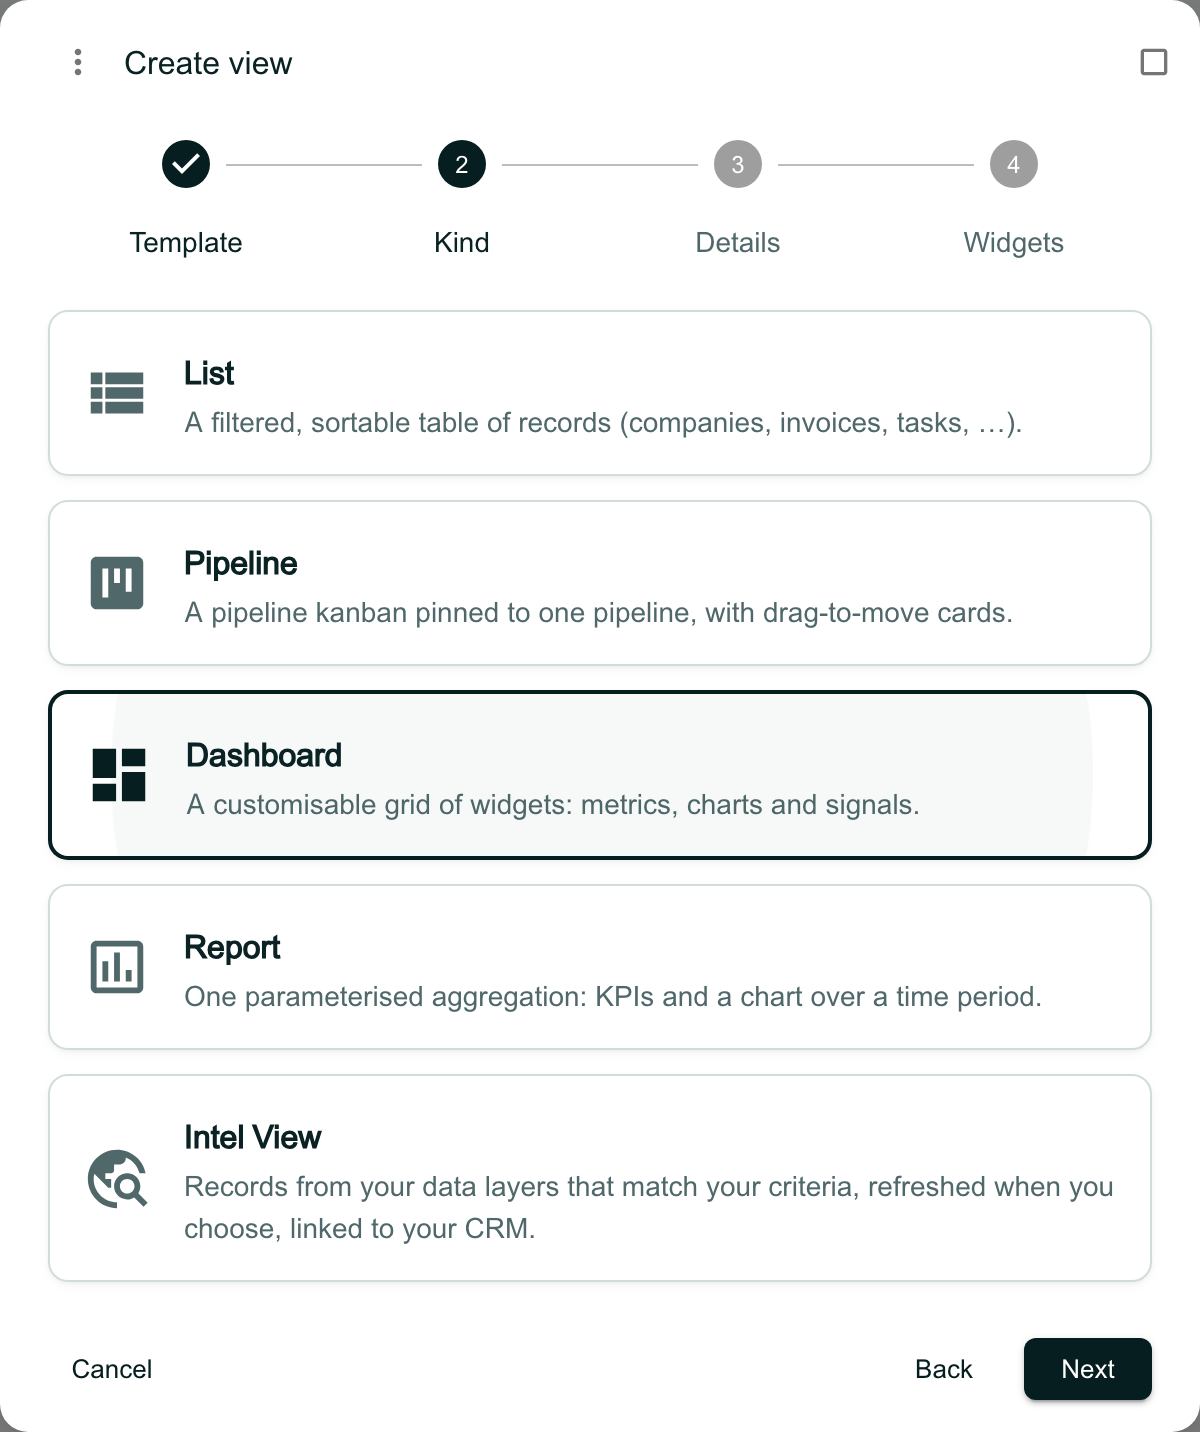
In Views, click the + at the end of the tab strip and choose New view. Choose Start blank, then Dashboard, then Next.
Give the dashboard a name and click Next. On the Widgets step, untick any widgets you do not want, then click Create.
Open Edit layout
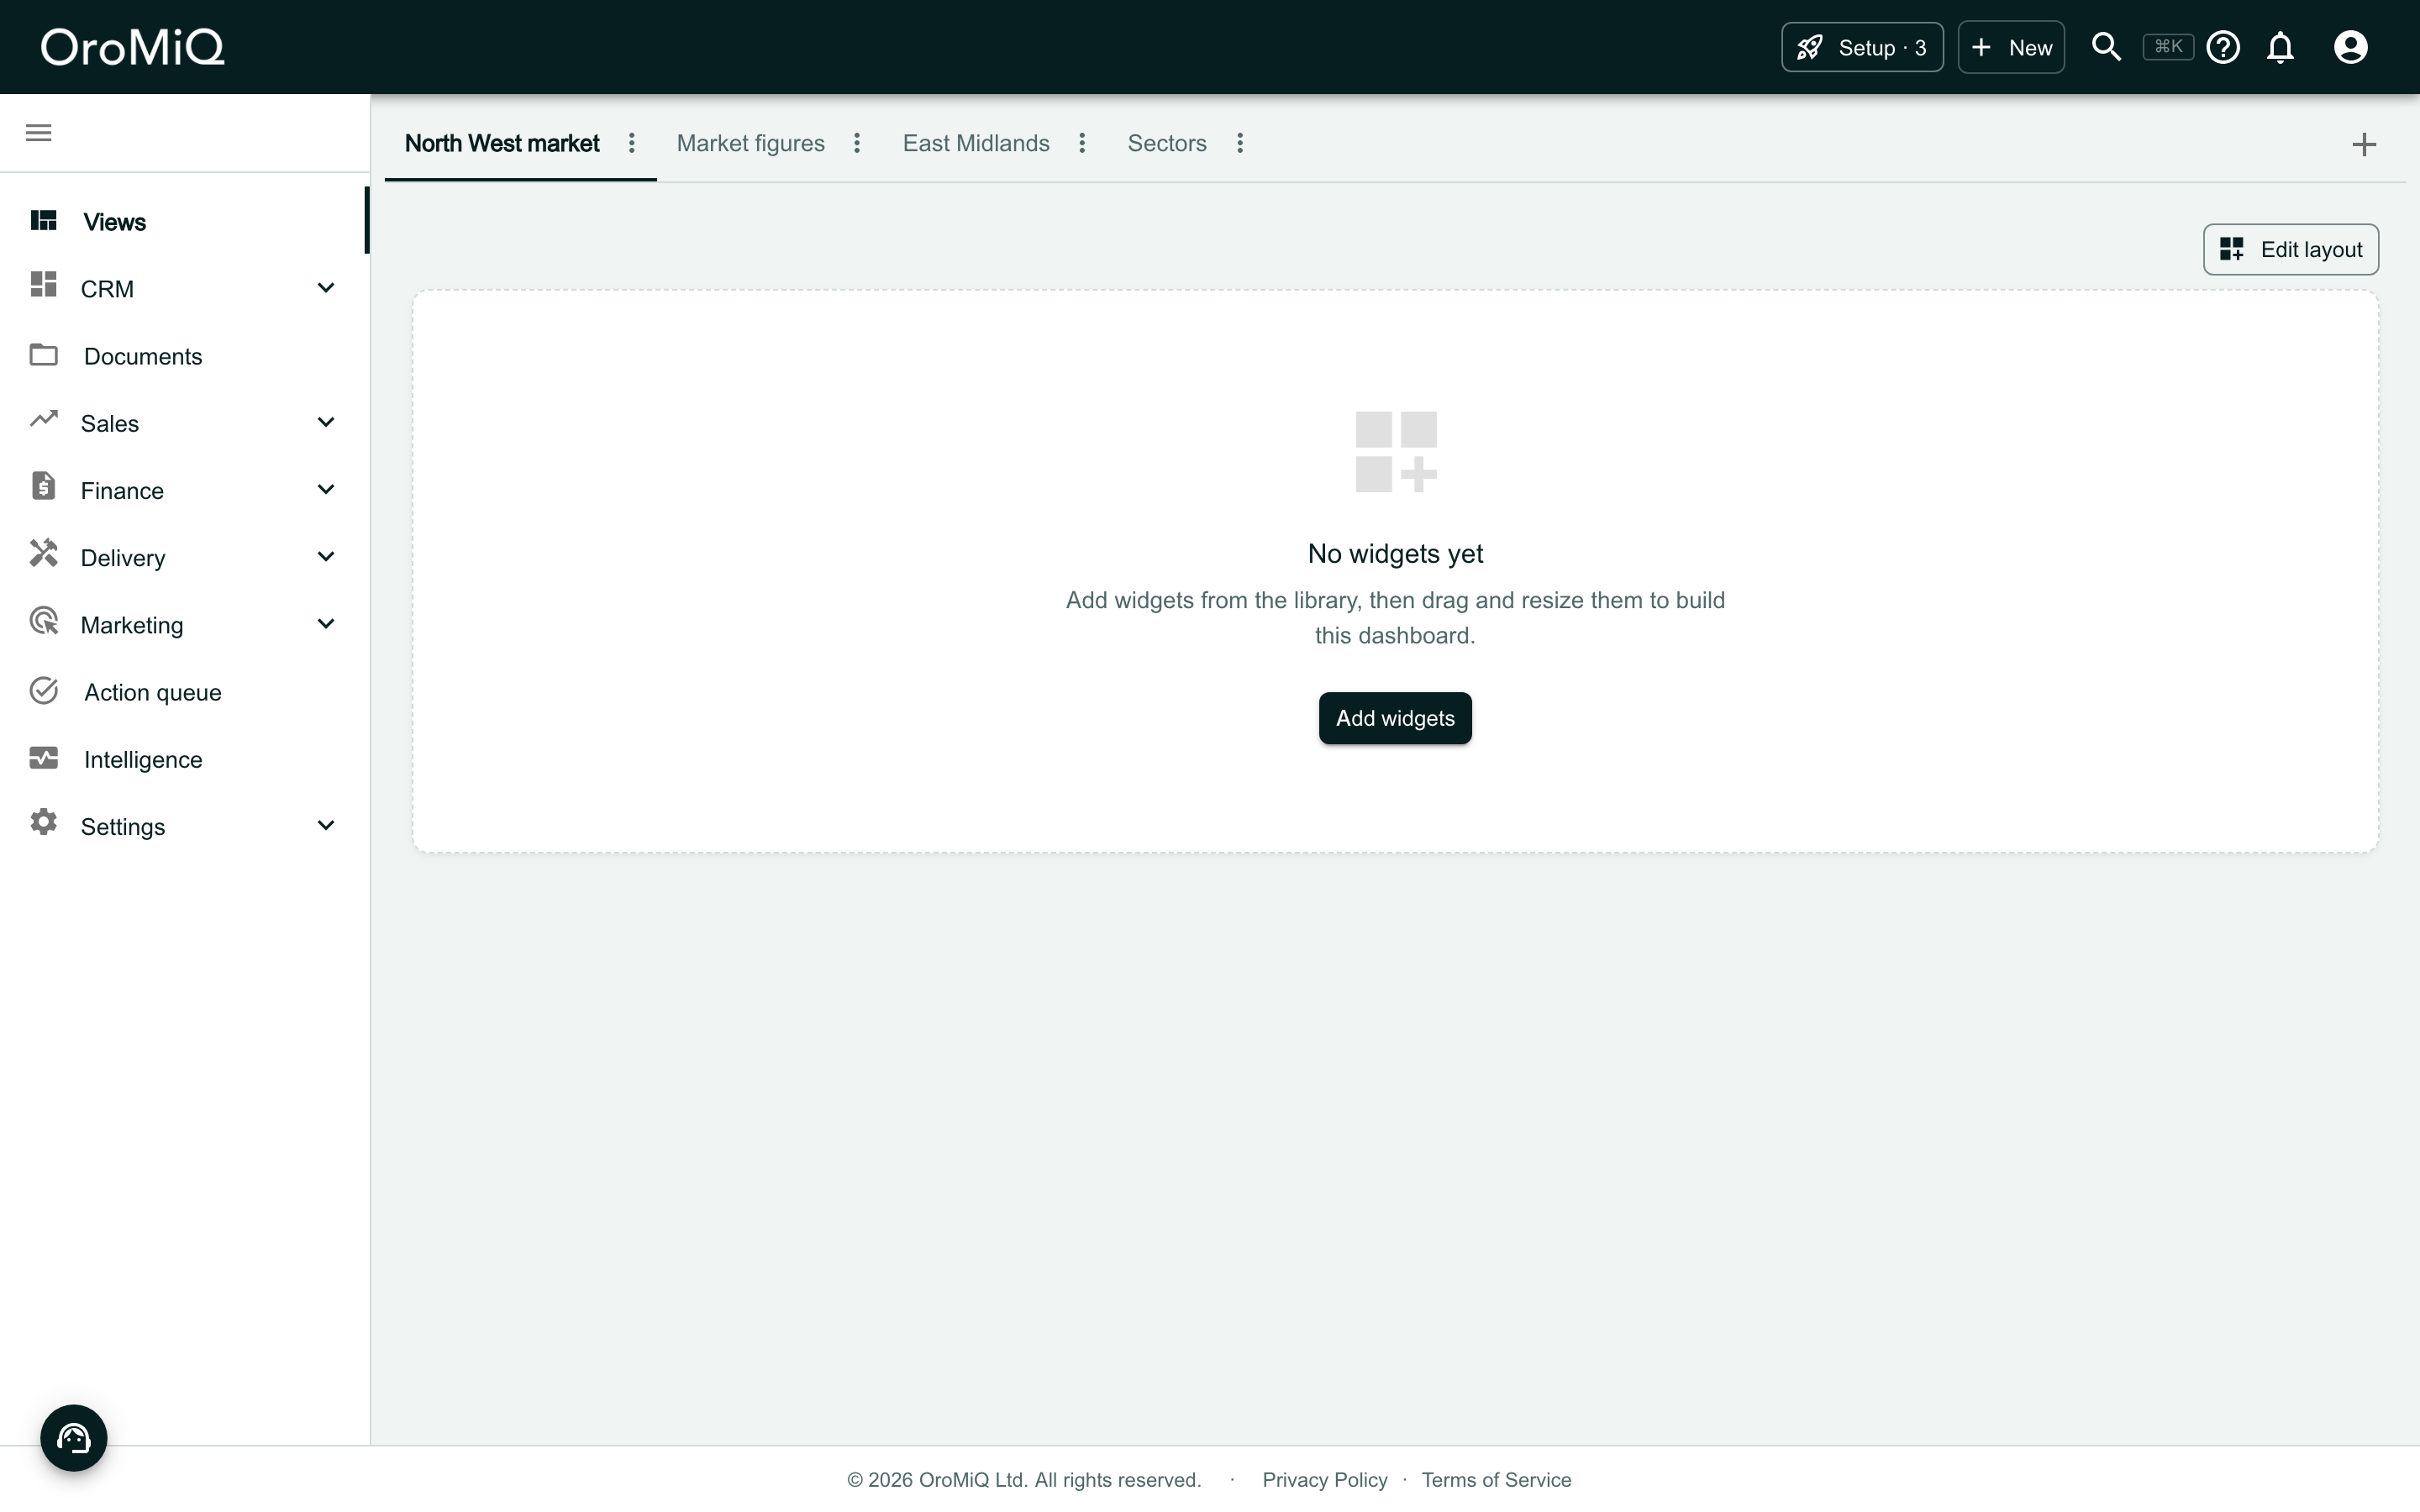
Click Edit layout, then Add widget. If you already have a dashboard of your own, you can open that instead and start here.
Add the Spread widget
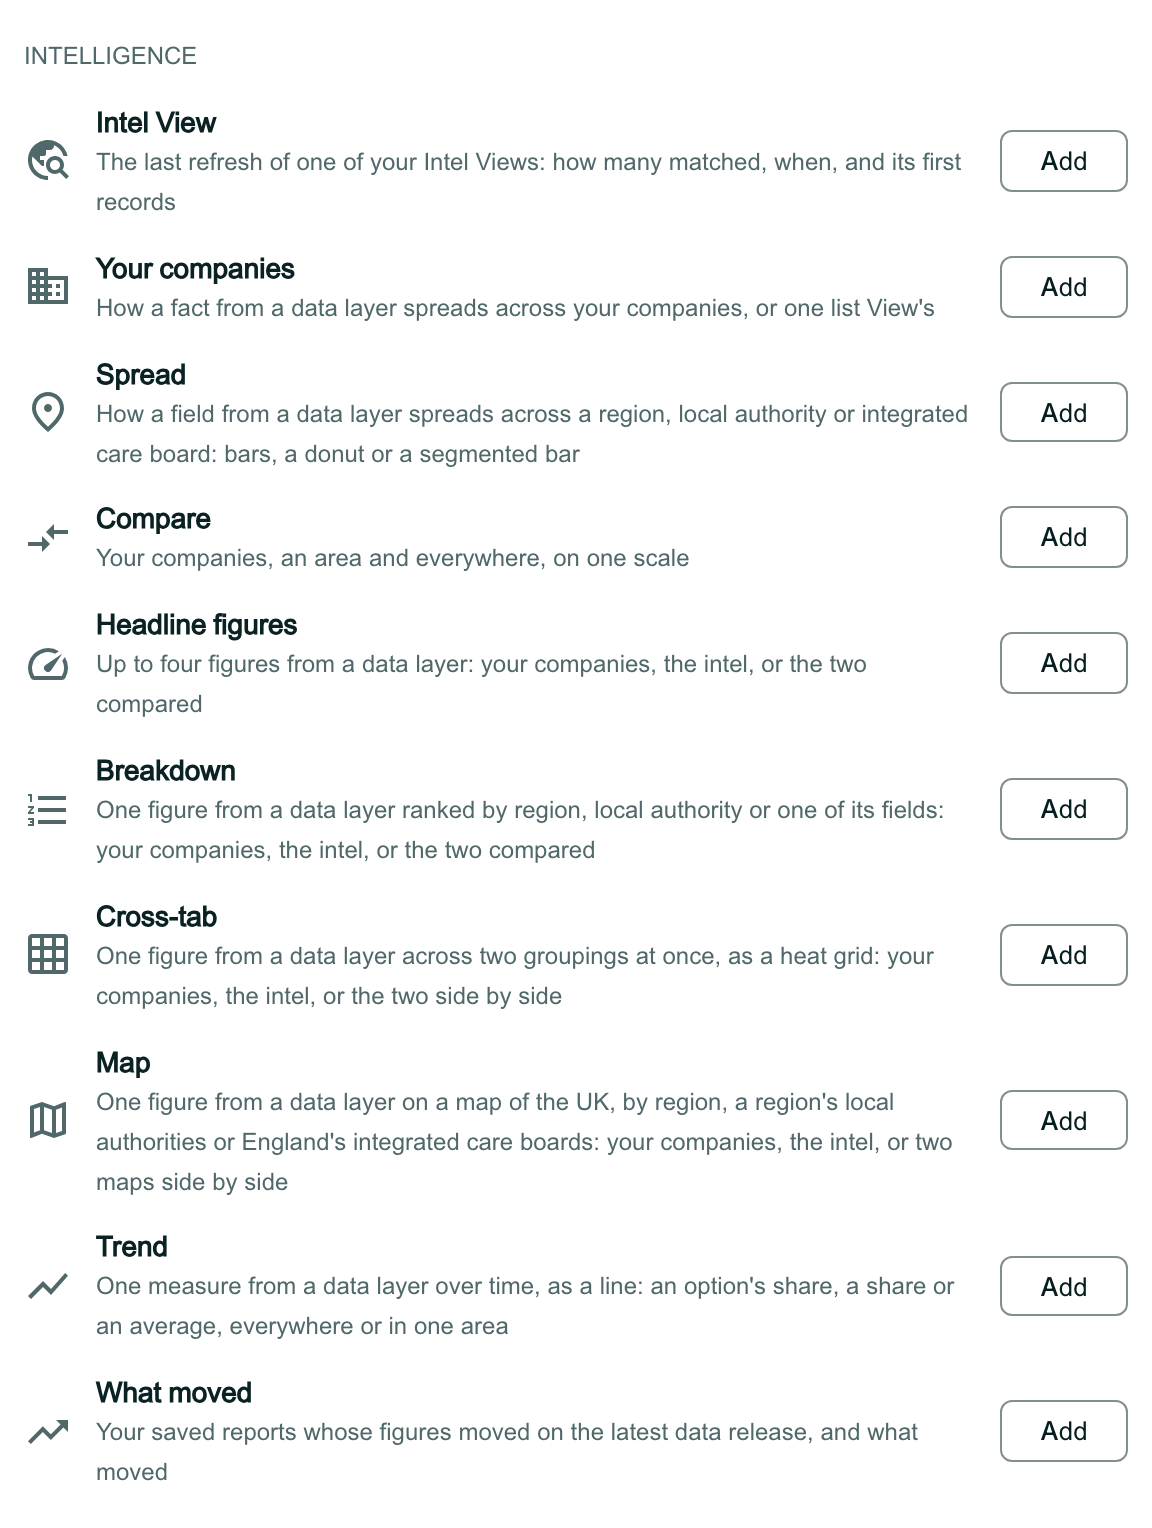
Build a chart sits at the top of Add a widget, for making a chart of your own (see Build a chart widget). This guide adds ready-made widgets.
Scroll down to the Intelligence group under Ready-made and click Add beside Spread.
Open the widget's settings
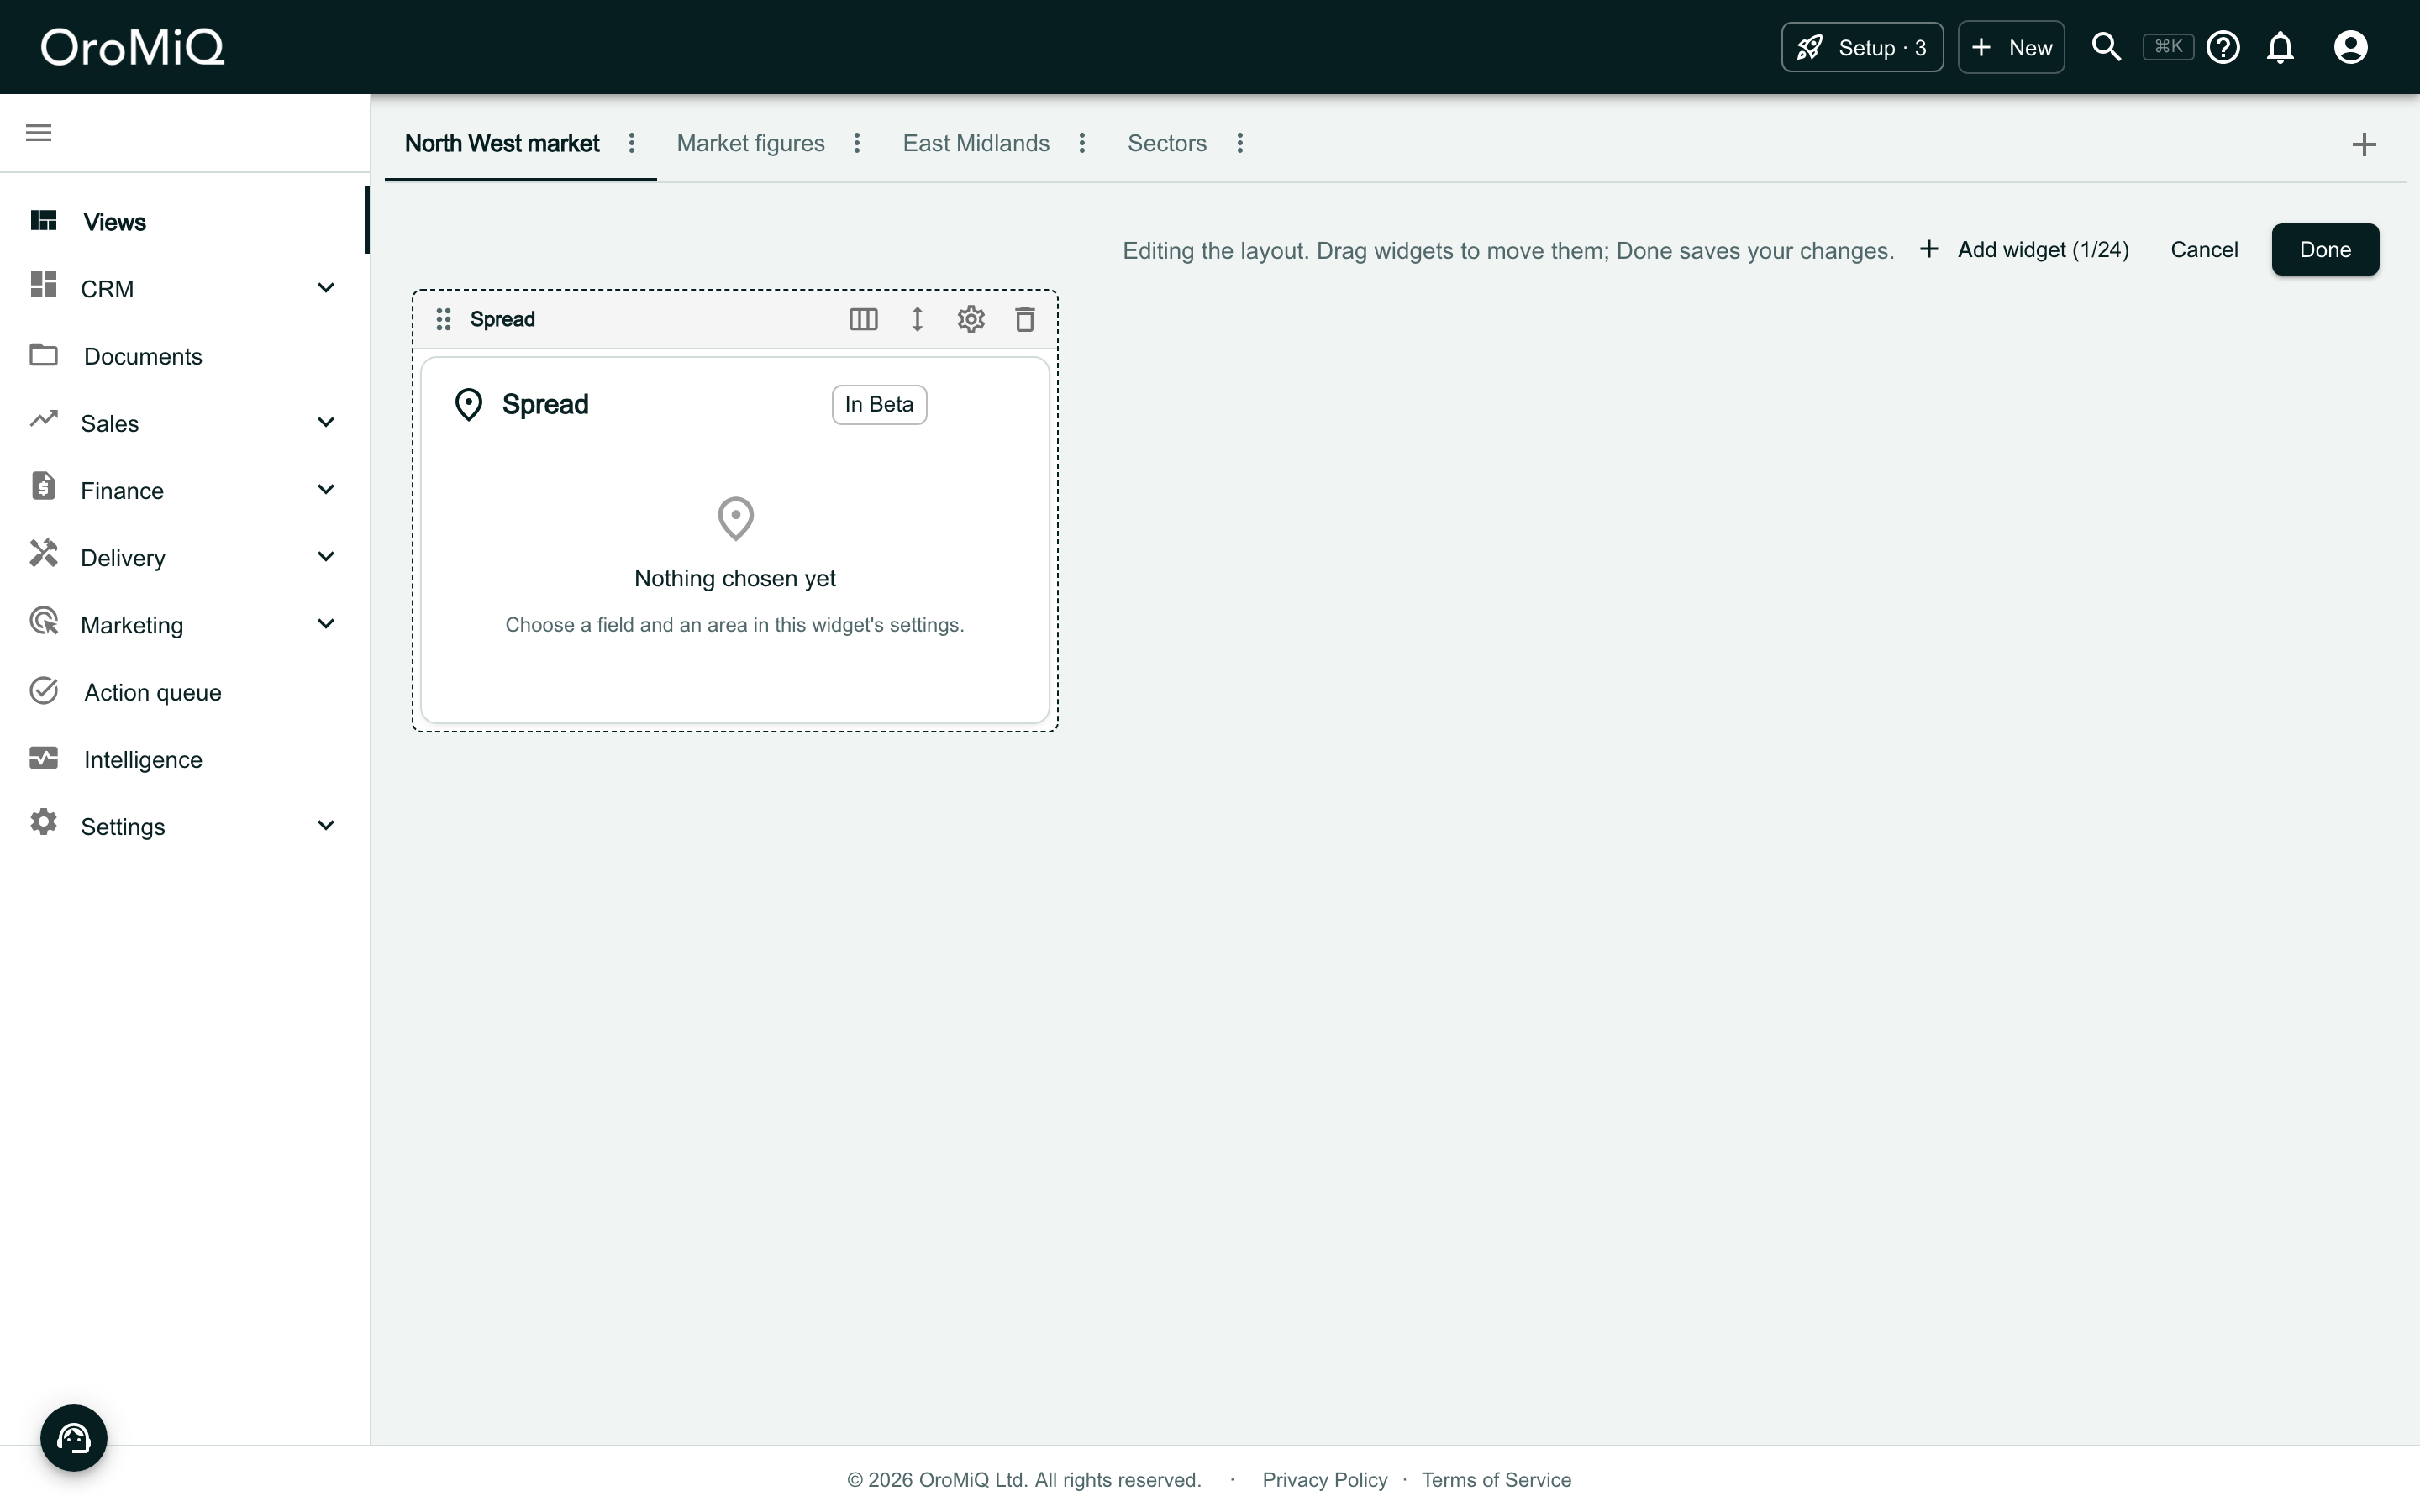
The widget says Nothing chosen yet. Click the gear icon in the strip above it.
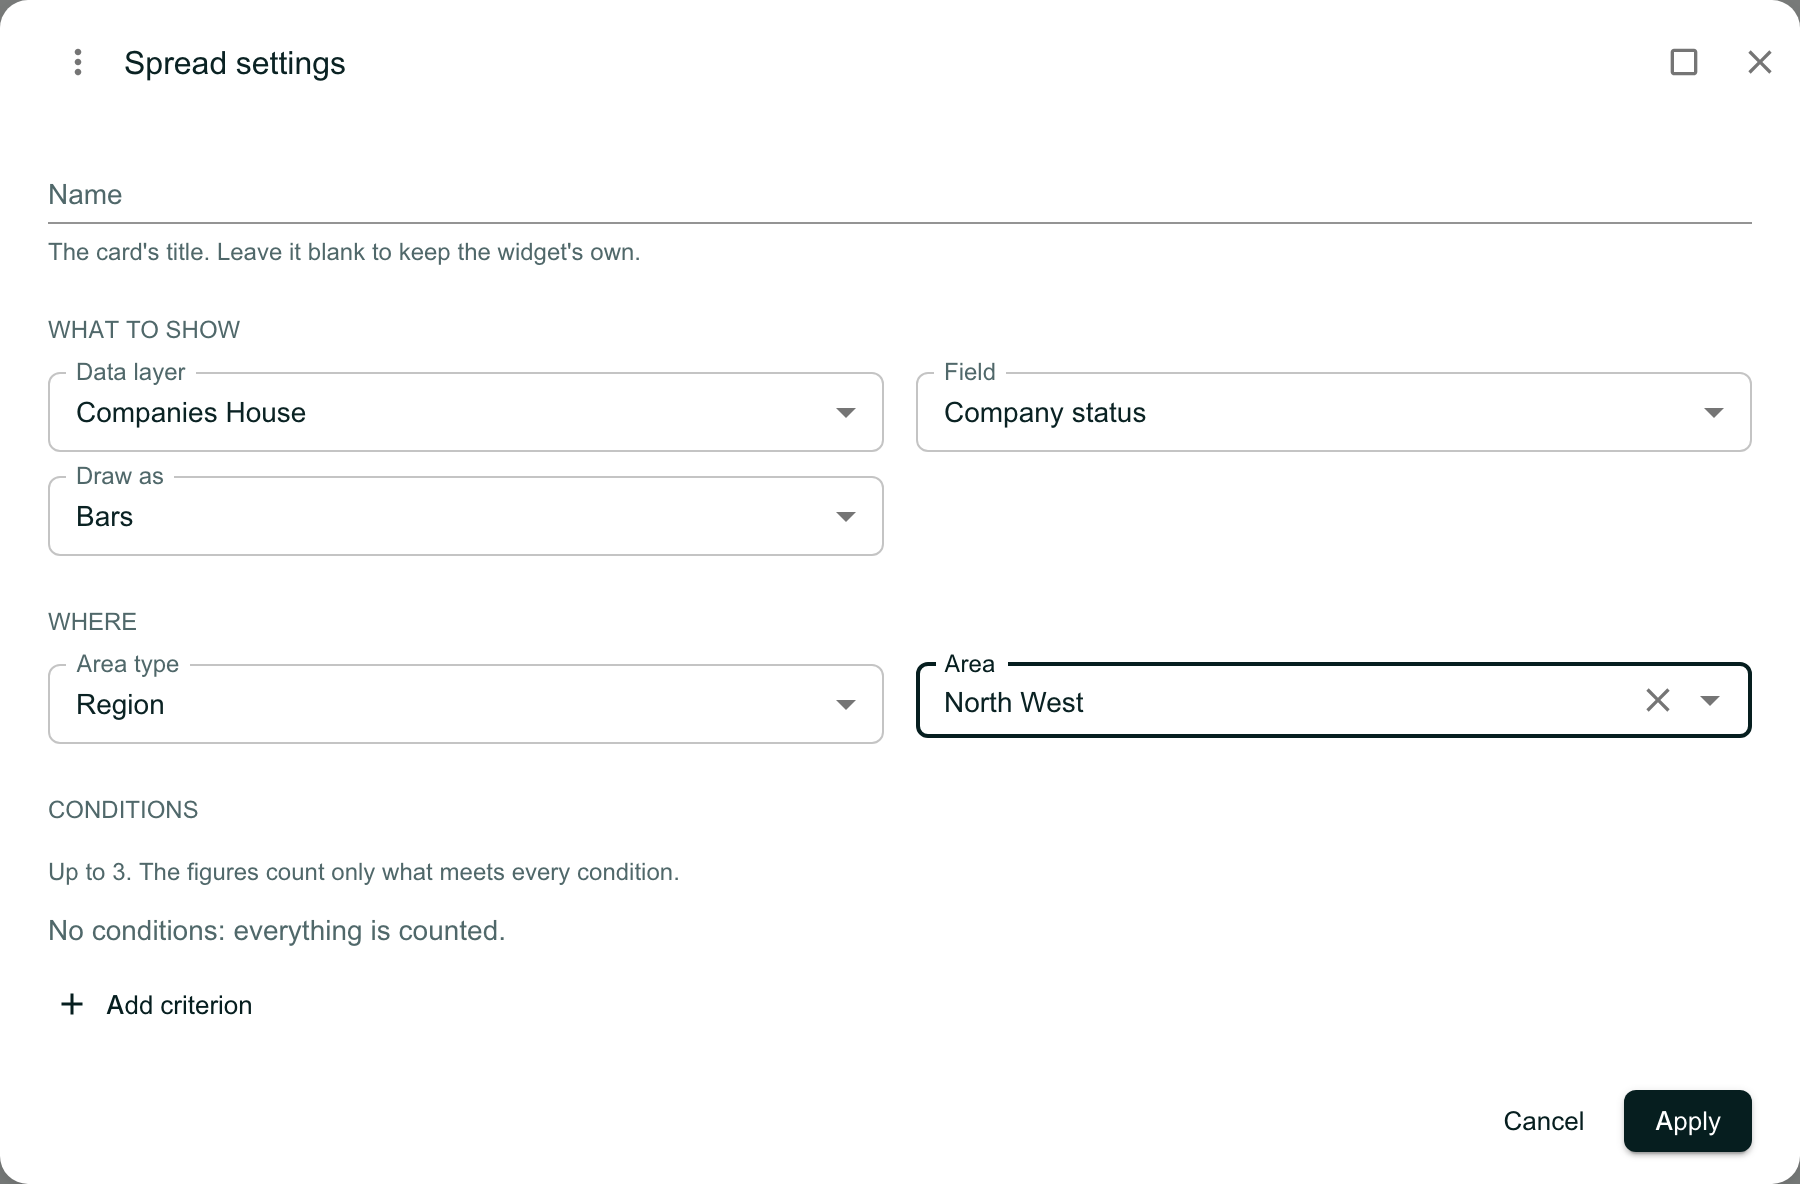
Choose the data layer, field and area
Fill in the settings, then click Apply:
- Data layer: one of the layers switched on for your workspace.
- Field: what to count. You are offered fields that fall into groups, such as a choice, a yes or no, or a list.
- Draw as: how the figures are drawn, such as Bars.
- Area type: Region or Local authority.
- Area: the region or local authority itself.
Name and Conditions are optional: leave the name blank to keep the widget’s own title, and with no conditions everything is counted.
Add Compare, then save
Click Add widget again and click Add beside Compare. Open its gear icon, choose the same four settings, and click Apply.
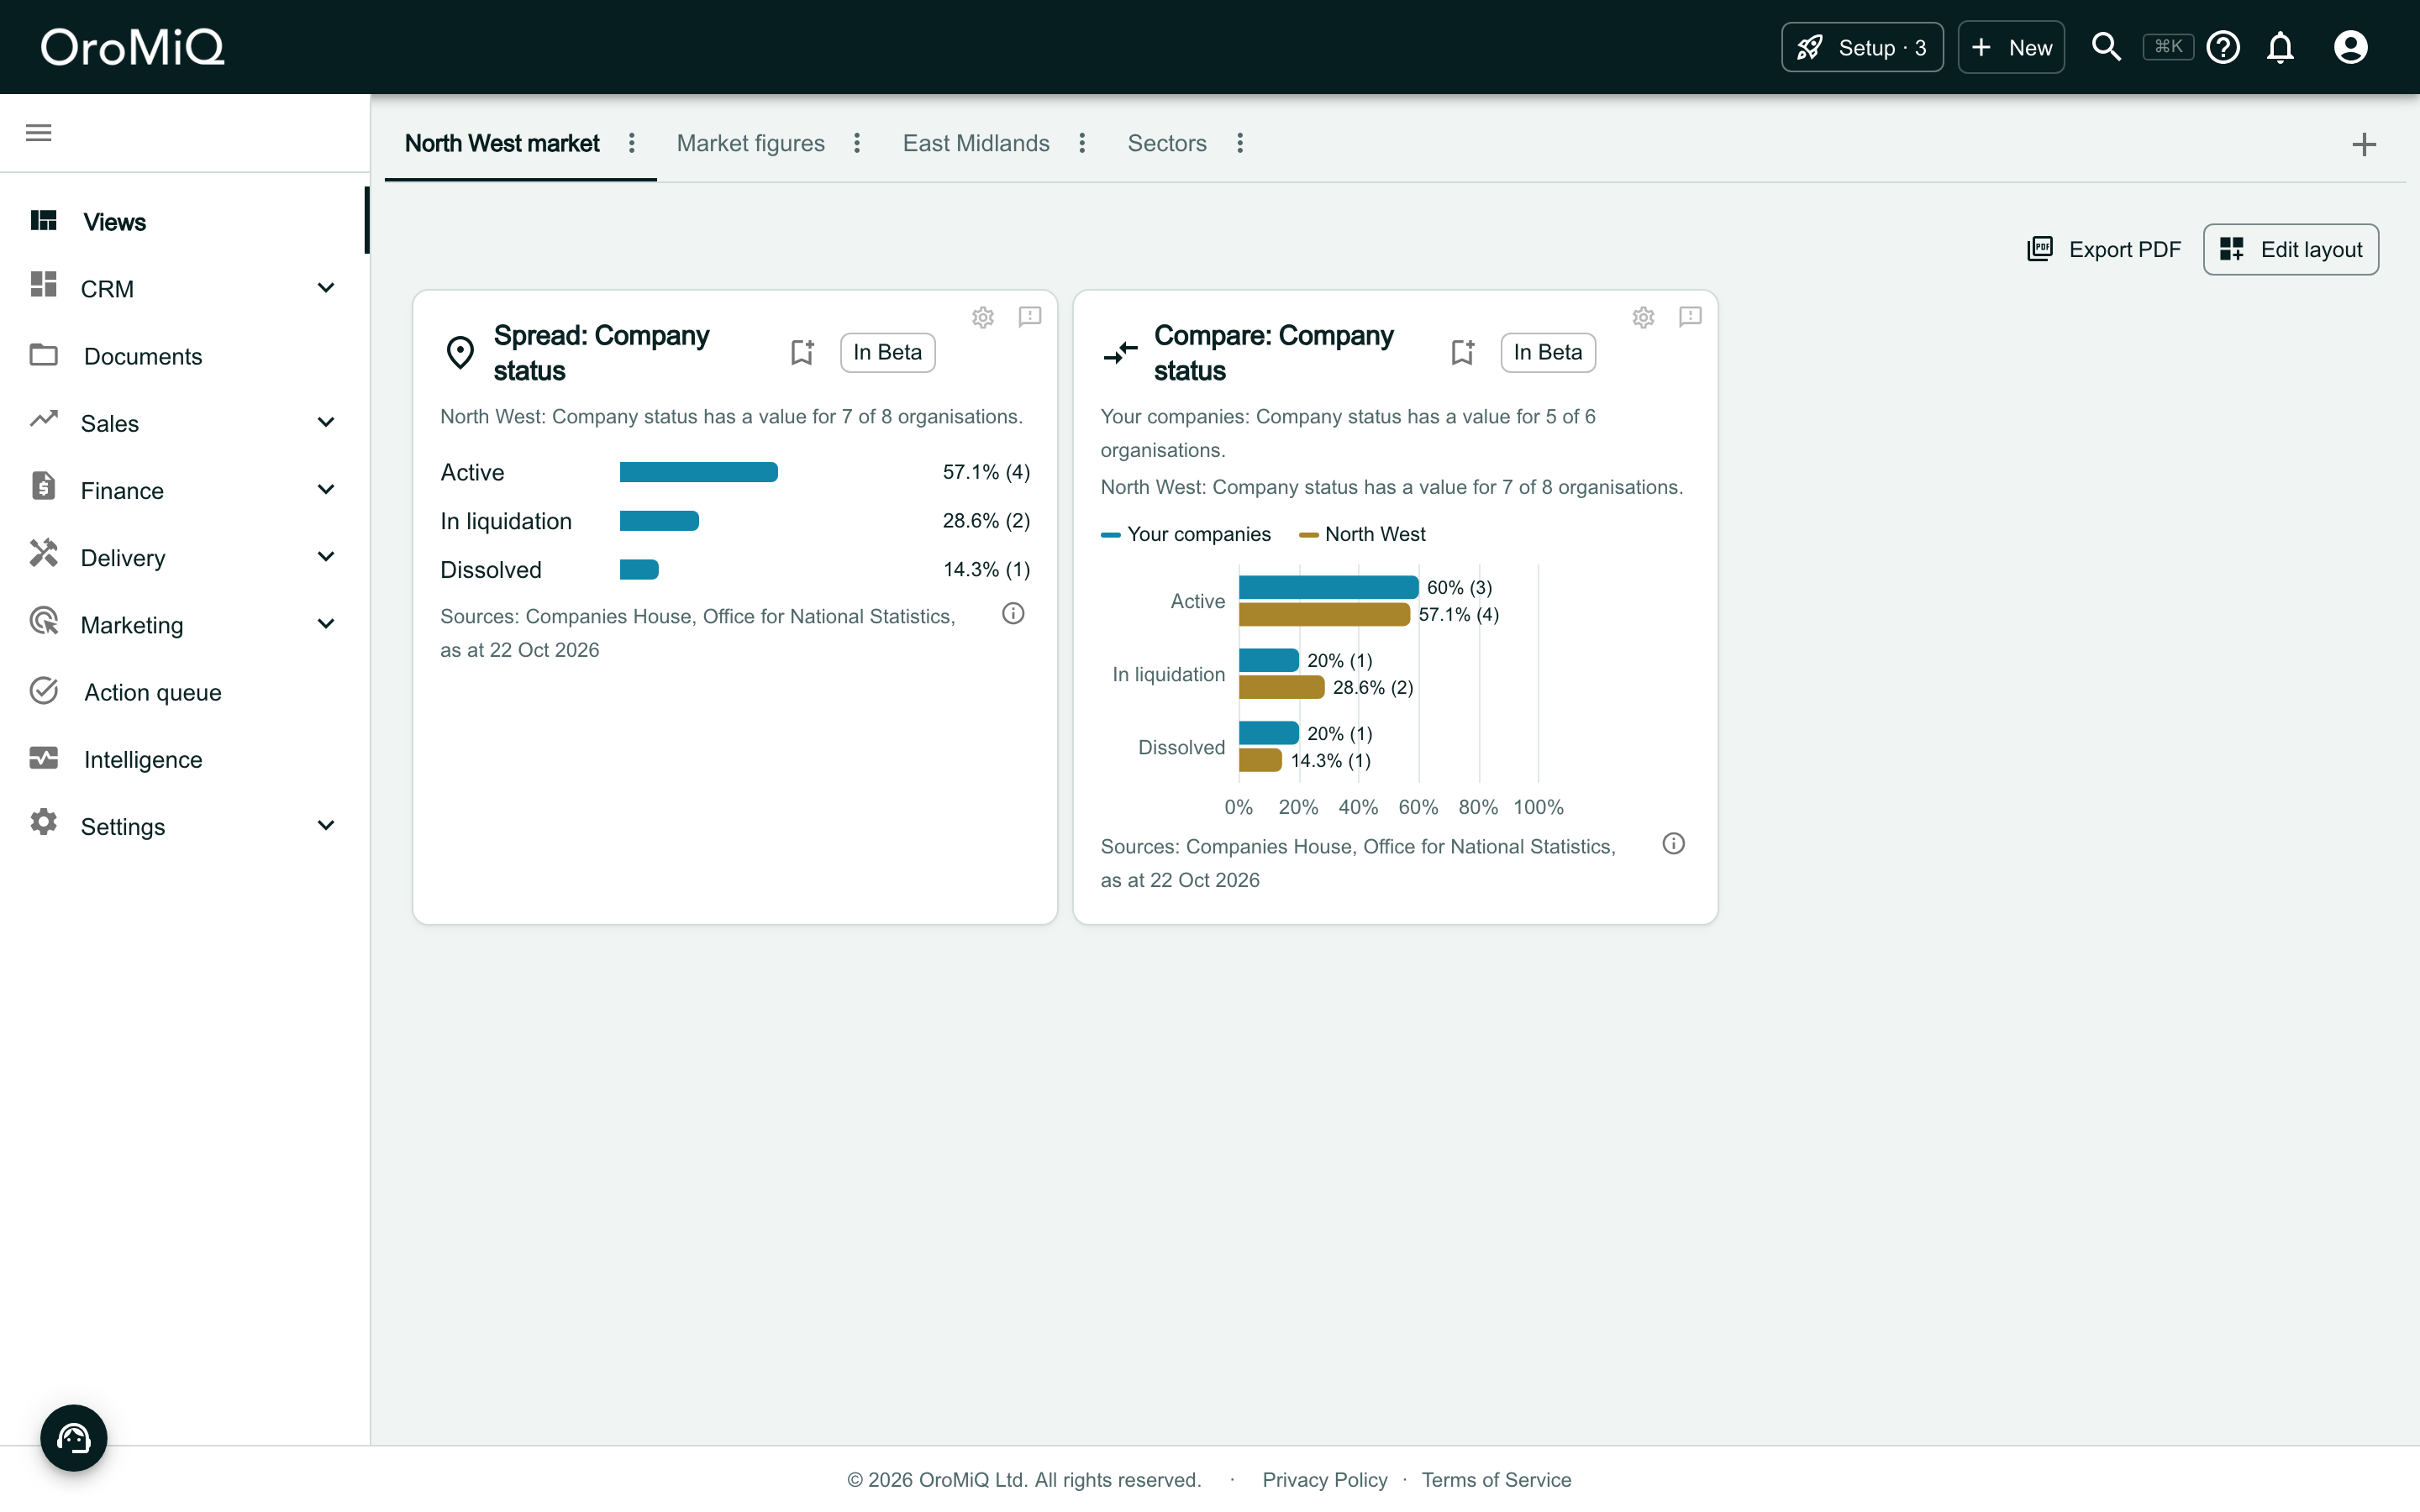
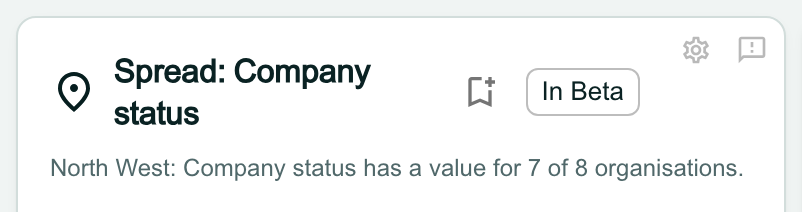
Click Done to save the layout. Nothing is saved until you do. Each card is titled with its field, such as Spread: Company status.
Read the Spread figures
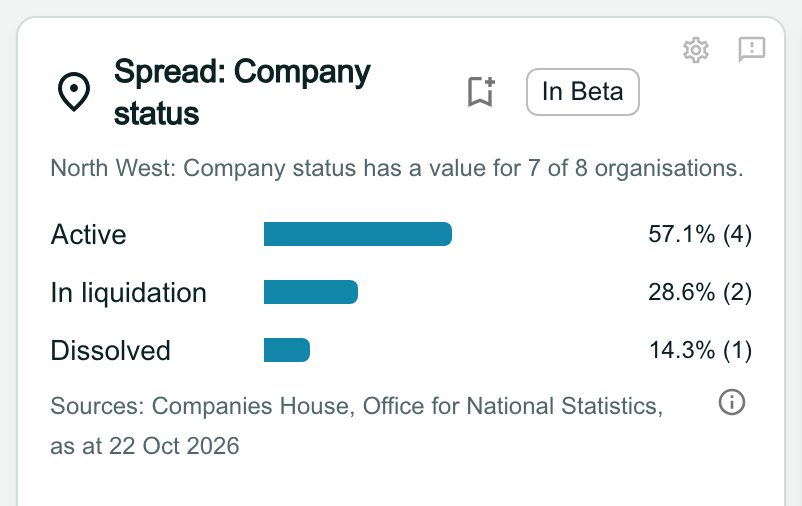
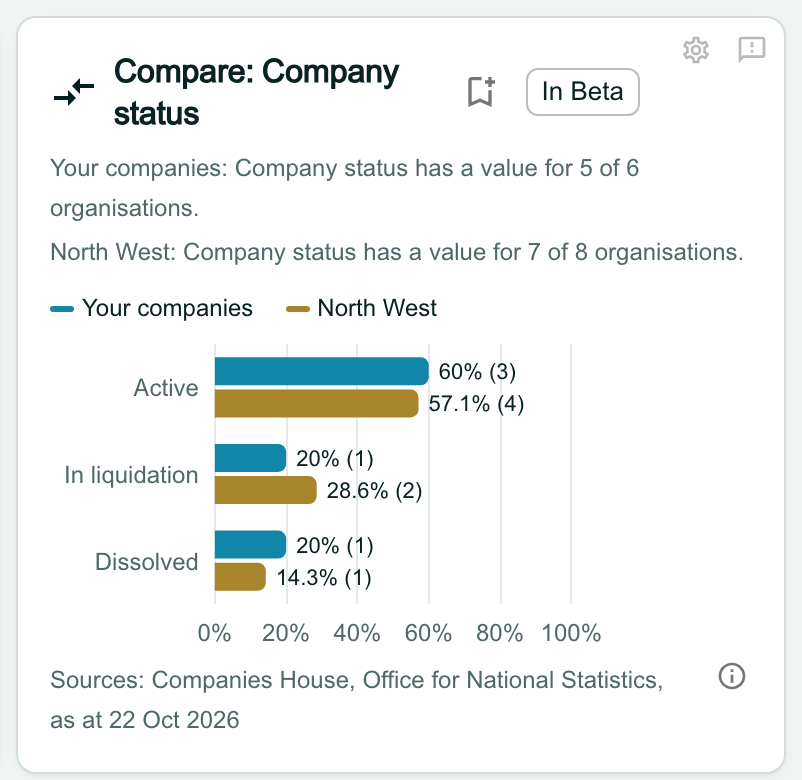
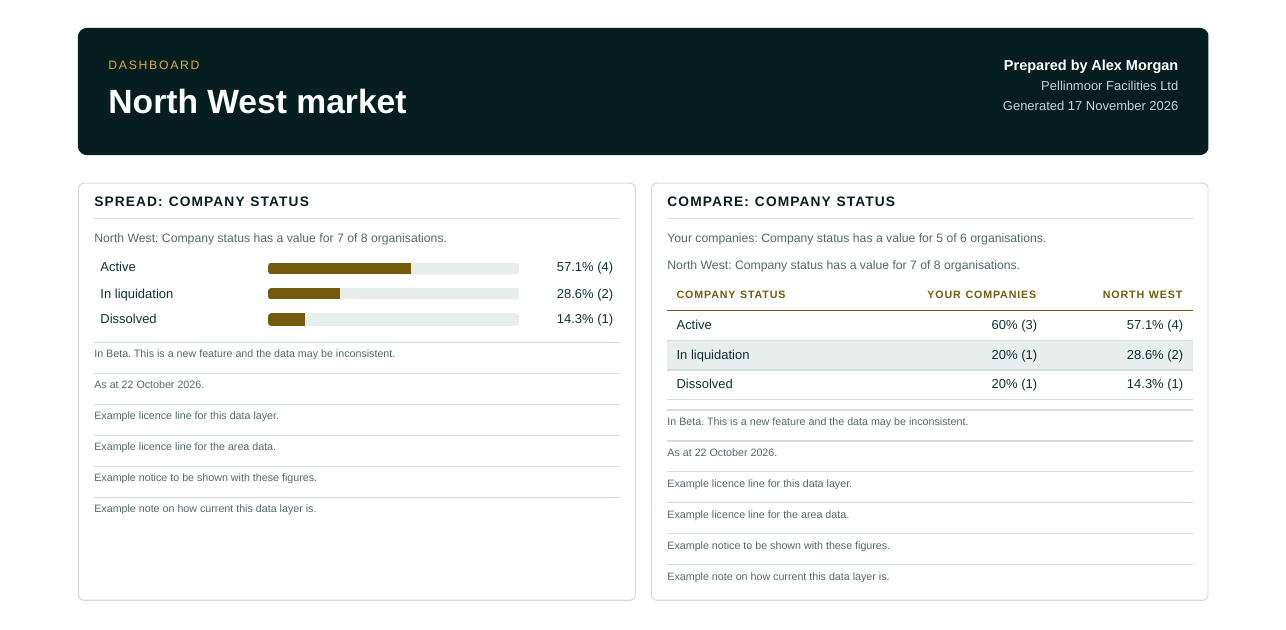
Percentages are of those with a value, and the line at the top says how many that is. Here, has a value for 7 of 8 organisations means the area has 8 records and 7 of them have a value for this field. So 57.1% (4) is 4 of those 7, not 4 of the 8.
The number in brackets is the count. The Sources line under the figures names where they come from and ends with the date they are as at.
Open the licence lines
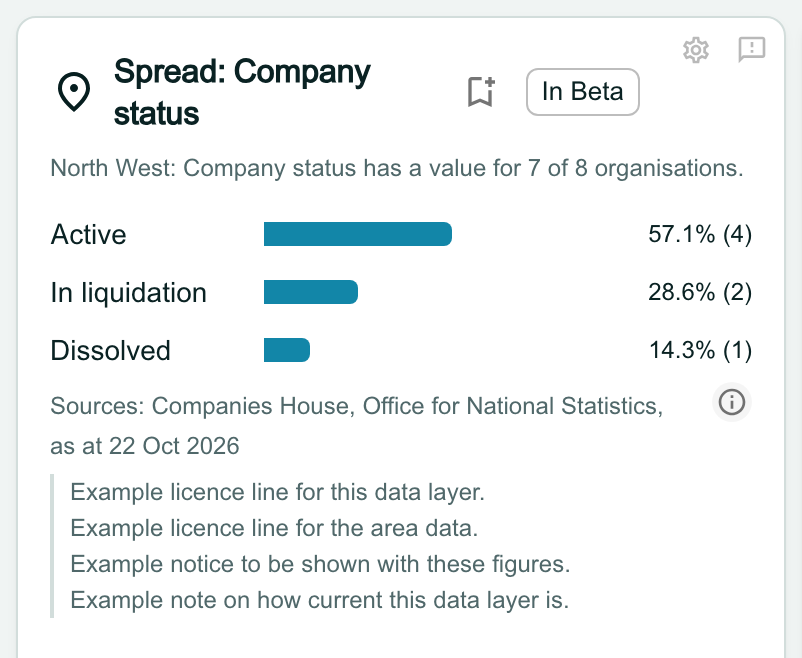
Click the info button at the end of the Sources line. The card opens out under it to list every line the data’s licences ask for, word for word: each source’s attribution, any notice, and how current the data is. Click the button again, or press Esc, to fold them away.
Read the Compare figures
Each value has two bars: your companies, then the area. Both use the same 0 to 100% scale, so you compare shares rather than counts. Each has its own line saying how many have a value.
Your companies means the companies linked to register records and held at Atlas, the service that supplies your data layers. It does not mean every company in your CRM, and it is not limited to the area you chose. A company with no linked record is not counted.
Understand a small group
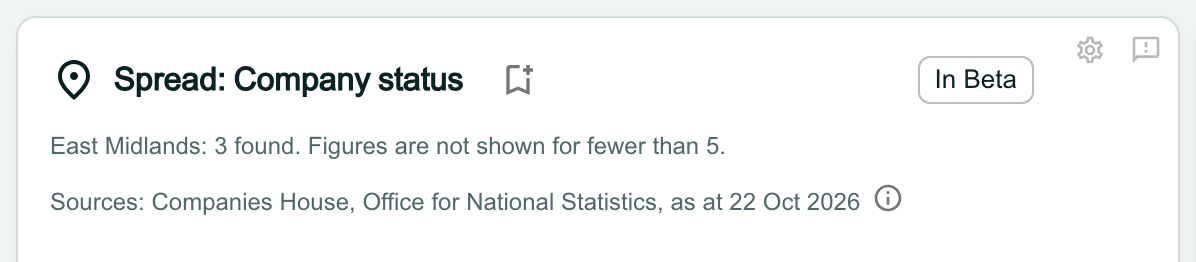
When a group has fewer than 5 records, the widget gives the number found and says Figures are not shown for fewer than 5.
To see figures, try a larger area. In Compare, the rule applies to each side separately, so one side can still show its figures while the key marks the other as fewer than 5.
Understand a total above 100%
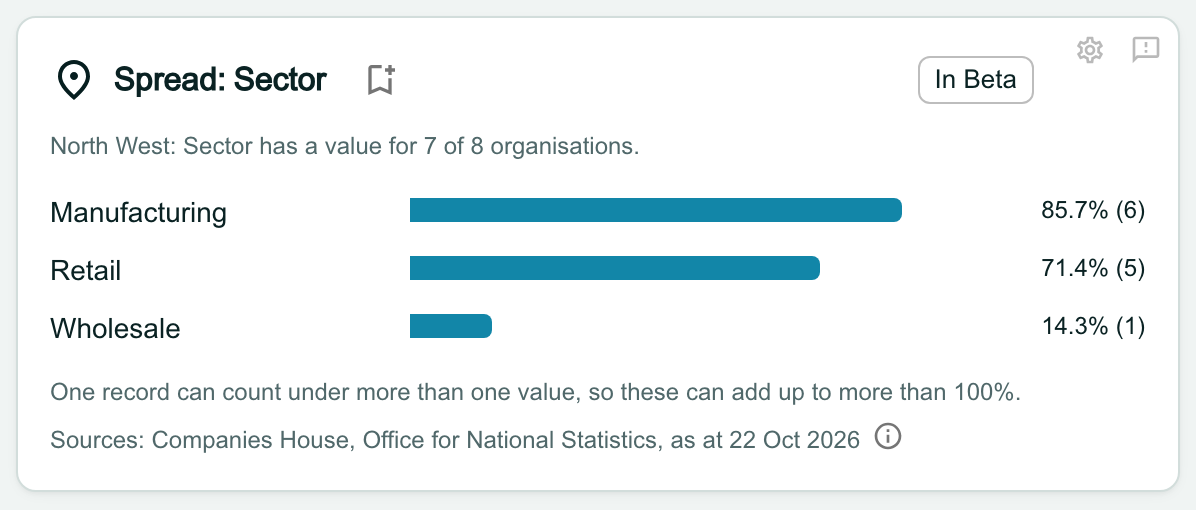
Some fields are lists, so one record can hold several values and count under each of them. The percentages can then add up to more than 100%, and the widget says so. This is correct, not an error.
Give a new workspace's Compare a moment
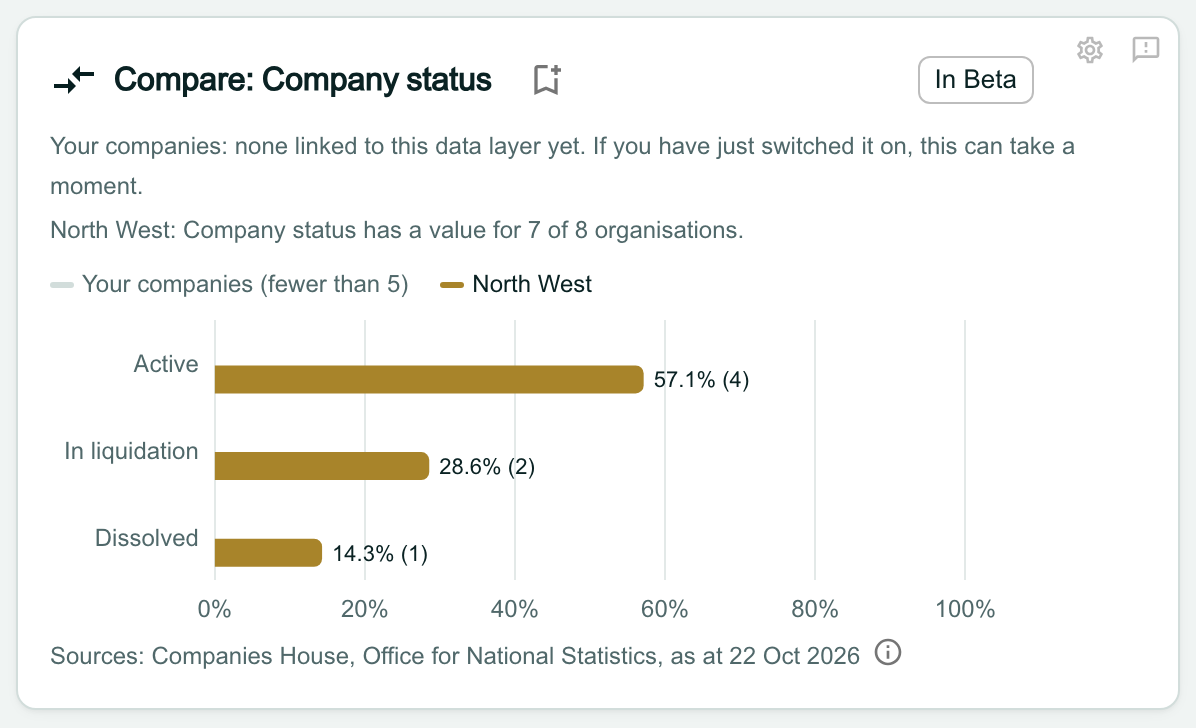
In a new workspace, Compare can take a moment to fill in, because your linked companies are still reaching Atlas. Until then it shows Your companies: none linked to this data layer yet beside the area’s figures.
The widget checks again by itself for about two minutes, so you can leave the page open. If it still says so, reload the page. It stays that way if no company in your workspace is linked to a register record.
Know what In Beta means
Both widgets carry an In Beta label. It marks a new feature whose data may be inconsistent, so check a figure at its source before you rely on it.
Export the figures, and keep the licence lines with them
Click Export PDF above the dashboard. The figures print with the In Beta line, the date and every licence line, in full.
If you copy the figures anywhere else, such as a slide or an email, copy the licence lines and the date too. Our Terms ask you to keep the attribution and the date, as OroMiQ shows them, wherever you show or share this data. The Data sources page lists each source and its licence.
Note
If a widget says Not available to you
A dashboard can be shared with team members whose role does not include the chosen data layer. They see Not available to you and no figures, on screen and in the PDF. To change that, ask an admin about your role in Settings > Team & roles.

What next
Cannot find what you need? Browse the Help Centre or submit a support ticket.