Dashboards & reporting

Build a chart widget

9 min read
Build a chart, at the top of Add a widget, makes a chart of your own on a dashboard. You pick the kind of chart first, then the data and the question it answers, and OroMiQ sets the chart up for you to check and adjust. This guide builds a donut of what you are owed, a heat grid of when calls and emails happen, a scatter of big deals that have gone stale, a flow of how deals moved between stages, a waterfall of what changed your pipeline and a timeline of your contracts. It takes about fifteen minutes.

Before you start

You need a dashboard in Views that you can change: you see Edit layout above it. See Customise your Home dashboard for moving, resizing and removing widgets.

The charts of your CRM data (sales, activity, invoices and so on) come from your reports, so your role needs access to them. Each report shows only to team members who may run it.

Note

The companies, invoices, calls and deals in these pictures are examples made up for this guide. Your charts show your own workspace’s records.

Open the dashboard in Edit layout

Open Views and the dashboard tab you want the chart on. Click Edit layout.
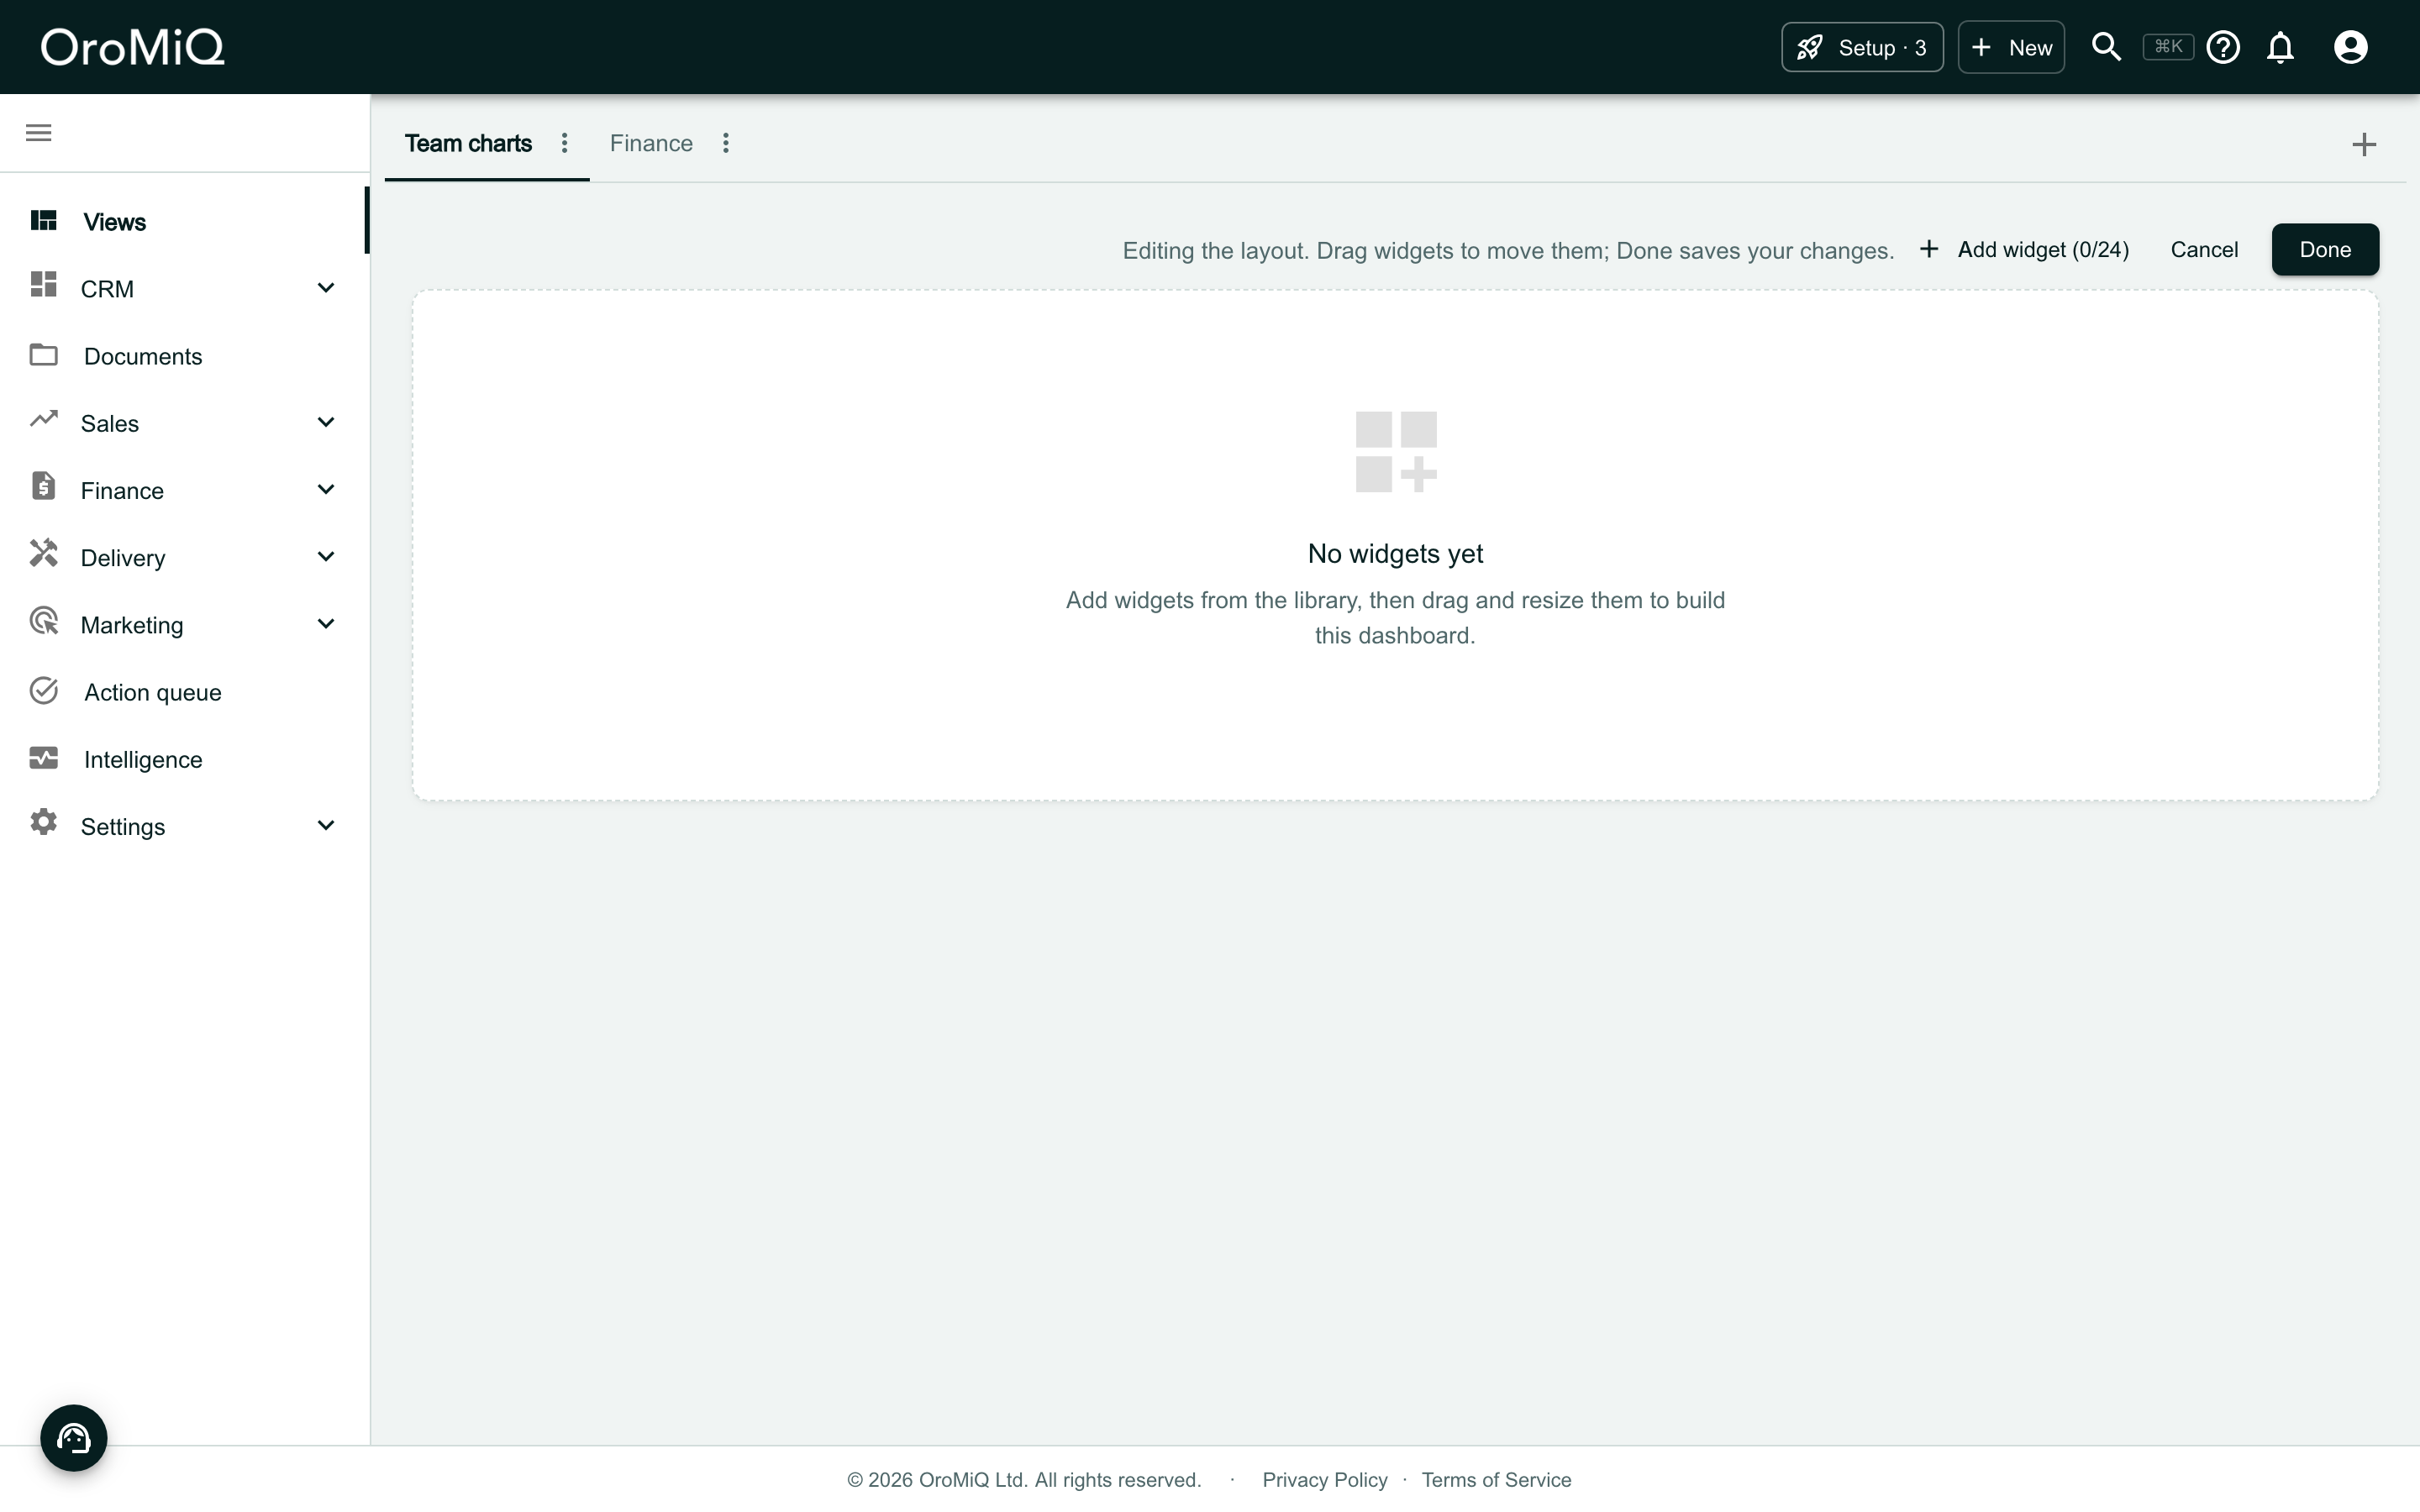
An empty dashboard tab called Team charts in Views, beside a tab called Finance. A bar reads Editing the layout. Drag widgets to move them; Done saves your changes, with Add widget (0/24), Cancel and Done. The dashboard reads No widgets yet.

Click Add widget

Click Add widget. Build a chart sits at the top, with a tile for each kind of chart. Point at a tile to see what it is good for.

The widgets under Ready-made are set up already and work as before. Typing in Search widgets hides the tiles and searches the ready-made widgets.
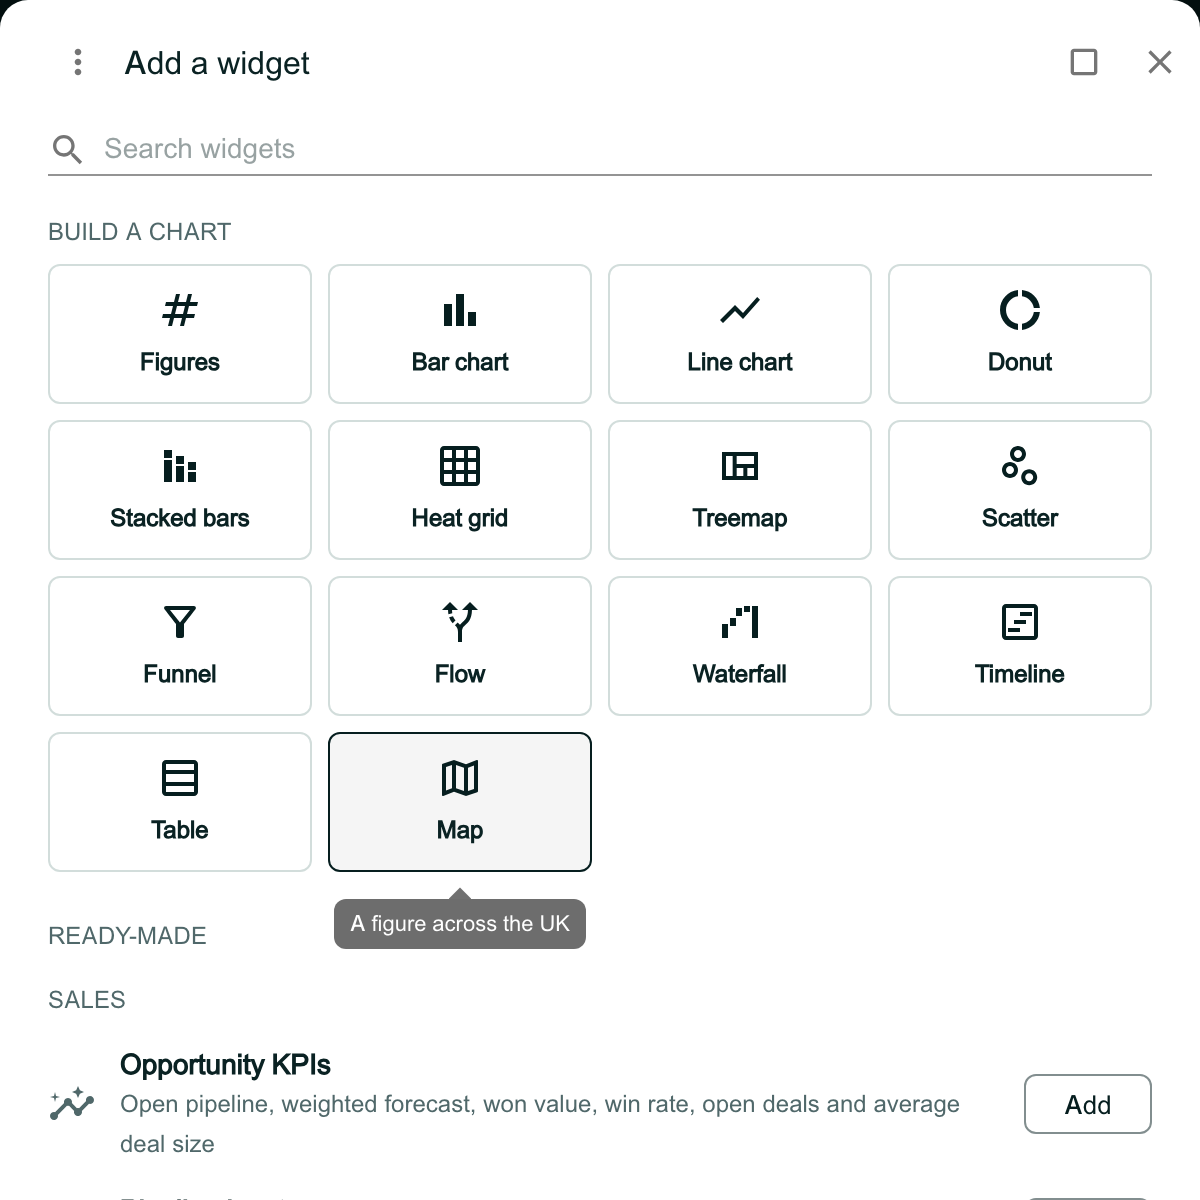
The Add a widget window. Under Search widgets, Build a chart shows fourteen tiles: Figures, Bar chart, Line chart, Donut, Stacked bars, Heat grid, Treemap, Scatter, Funnel, Flow, Waterfall, Timeline, Table and Map. The pointer is on Map, with the hint A figure across the UK. Below the tiles, Ready-made starts with Sales and Opportunity KPIs.

Know why a tile is greyed out

A greyed-out tile means nothing you can use draws as that chart. Point at it to see why. Which tiles you can use depends on your role and on what your workspace has switched on.
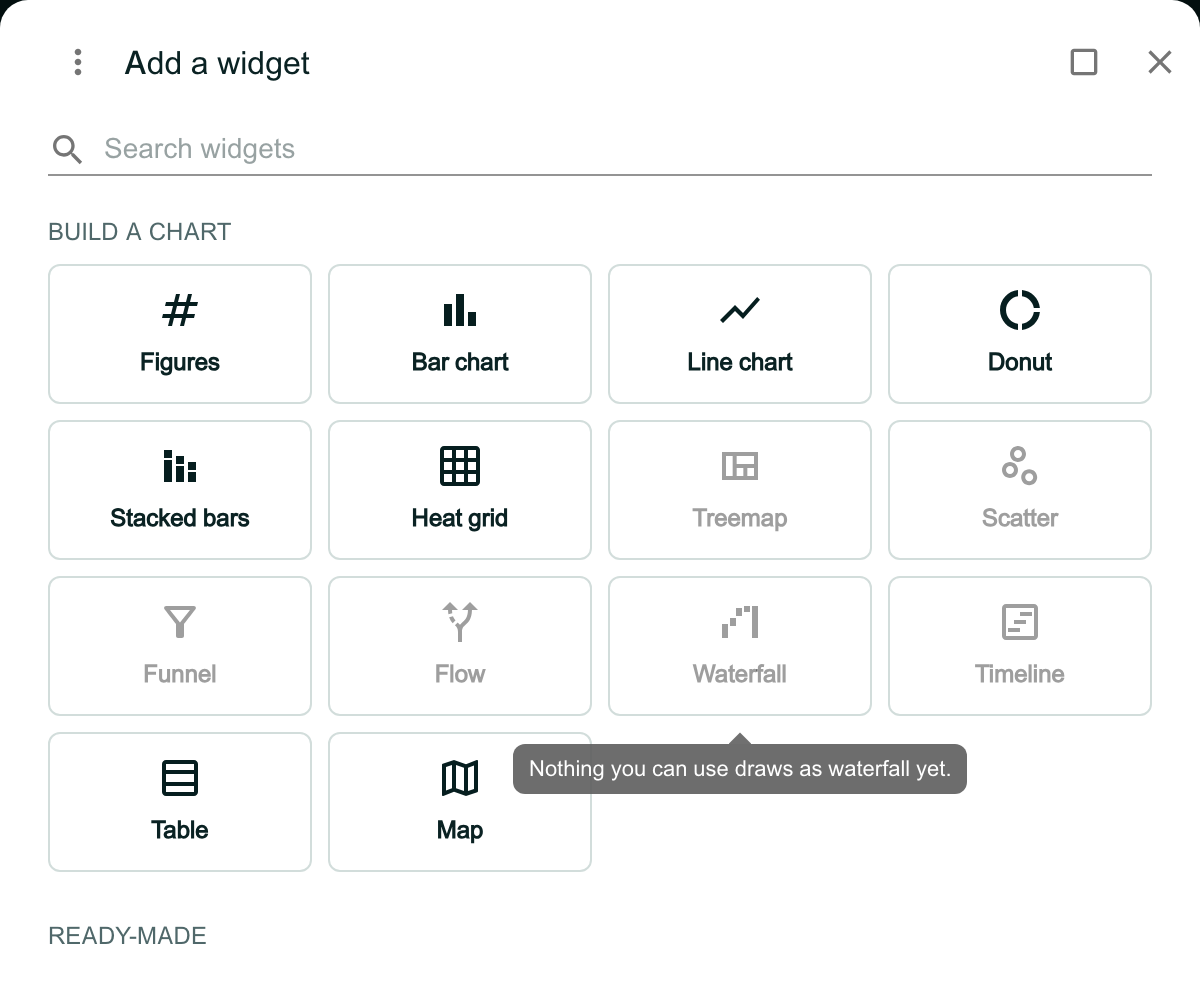
The Build a chart tiles for a team member whose role has no CRM reports. Treemap, Scatter, Funnel, Flow, Waterfall and Timeline are greyed out. The pointer is on Waterfall, with the tooltip Nothing you can use draws as waterfall yet.

Choose a chart, then the data

Click Donut. Pick the data, here Invoices: each chip lists the questions that data can answer as a donut. A greyed-out chip has none.

Click Choose beside Revenue & AR. To pick another chart, click Back.
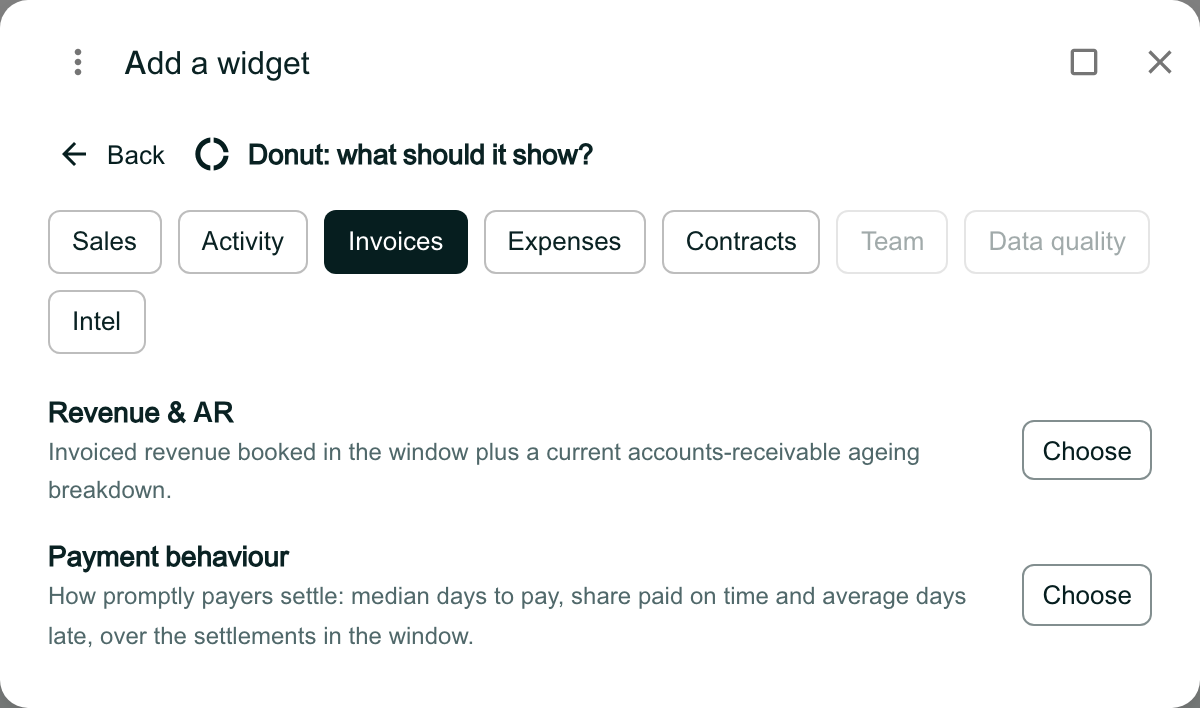
Add a widget reading Donut: what should it show?, with Back. Chips for Sales, Activity, Invoices (selected), Expenses, Contracts and Intel; Team and Data quality are greyed out. Under Invoices: Revenue & AR, Invoiced revenue booked in the window plus a current accounts-receivable ageing breakdown, and Payment behaviour, each with a Choose button.

Name the chart and check its settings

The chart goes on the dashboard and Chart settings opens, set up for the chart you picked:

  • Name: the card’s title. Leave it blank to use the report’s name.
  • Report: the report the chart runs. You can switch to another here.
  • Date range and Date field: the window the chart covers, and which date decides it.
  • Group by: how the figures are split, where the report offers it.

The preview at the foot shows the chart as it will look, and updates as you change the settings. A donut shows the report’s money where it has some, otherwise its count: here the Balance due, with the total in the middle.
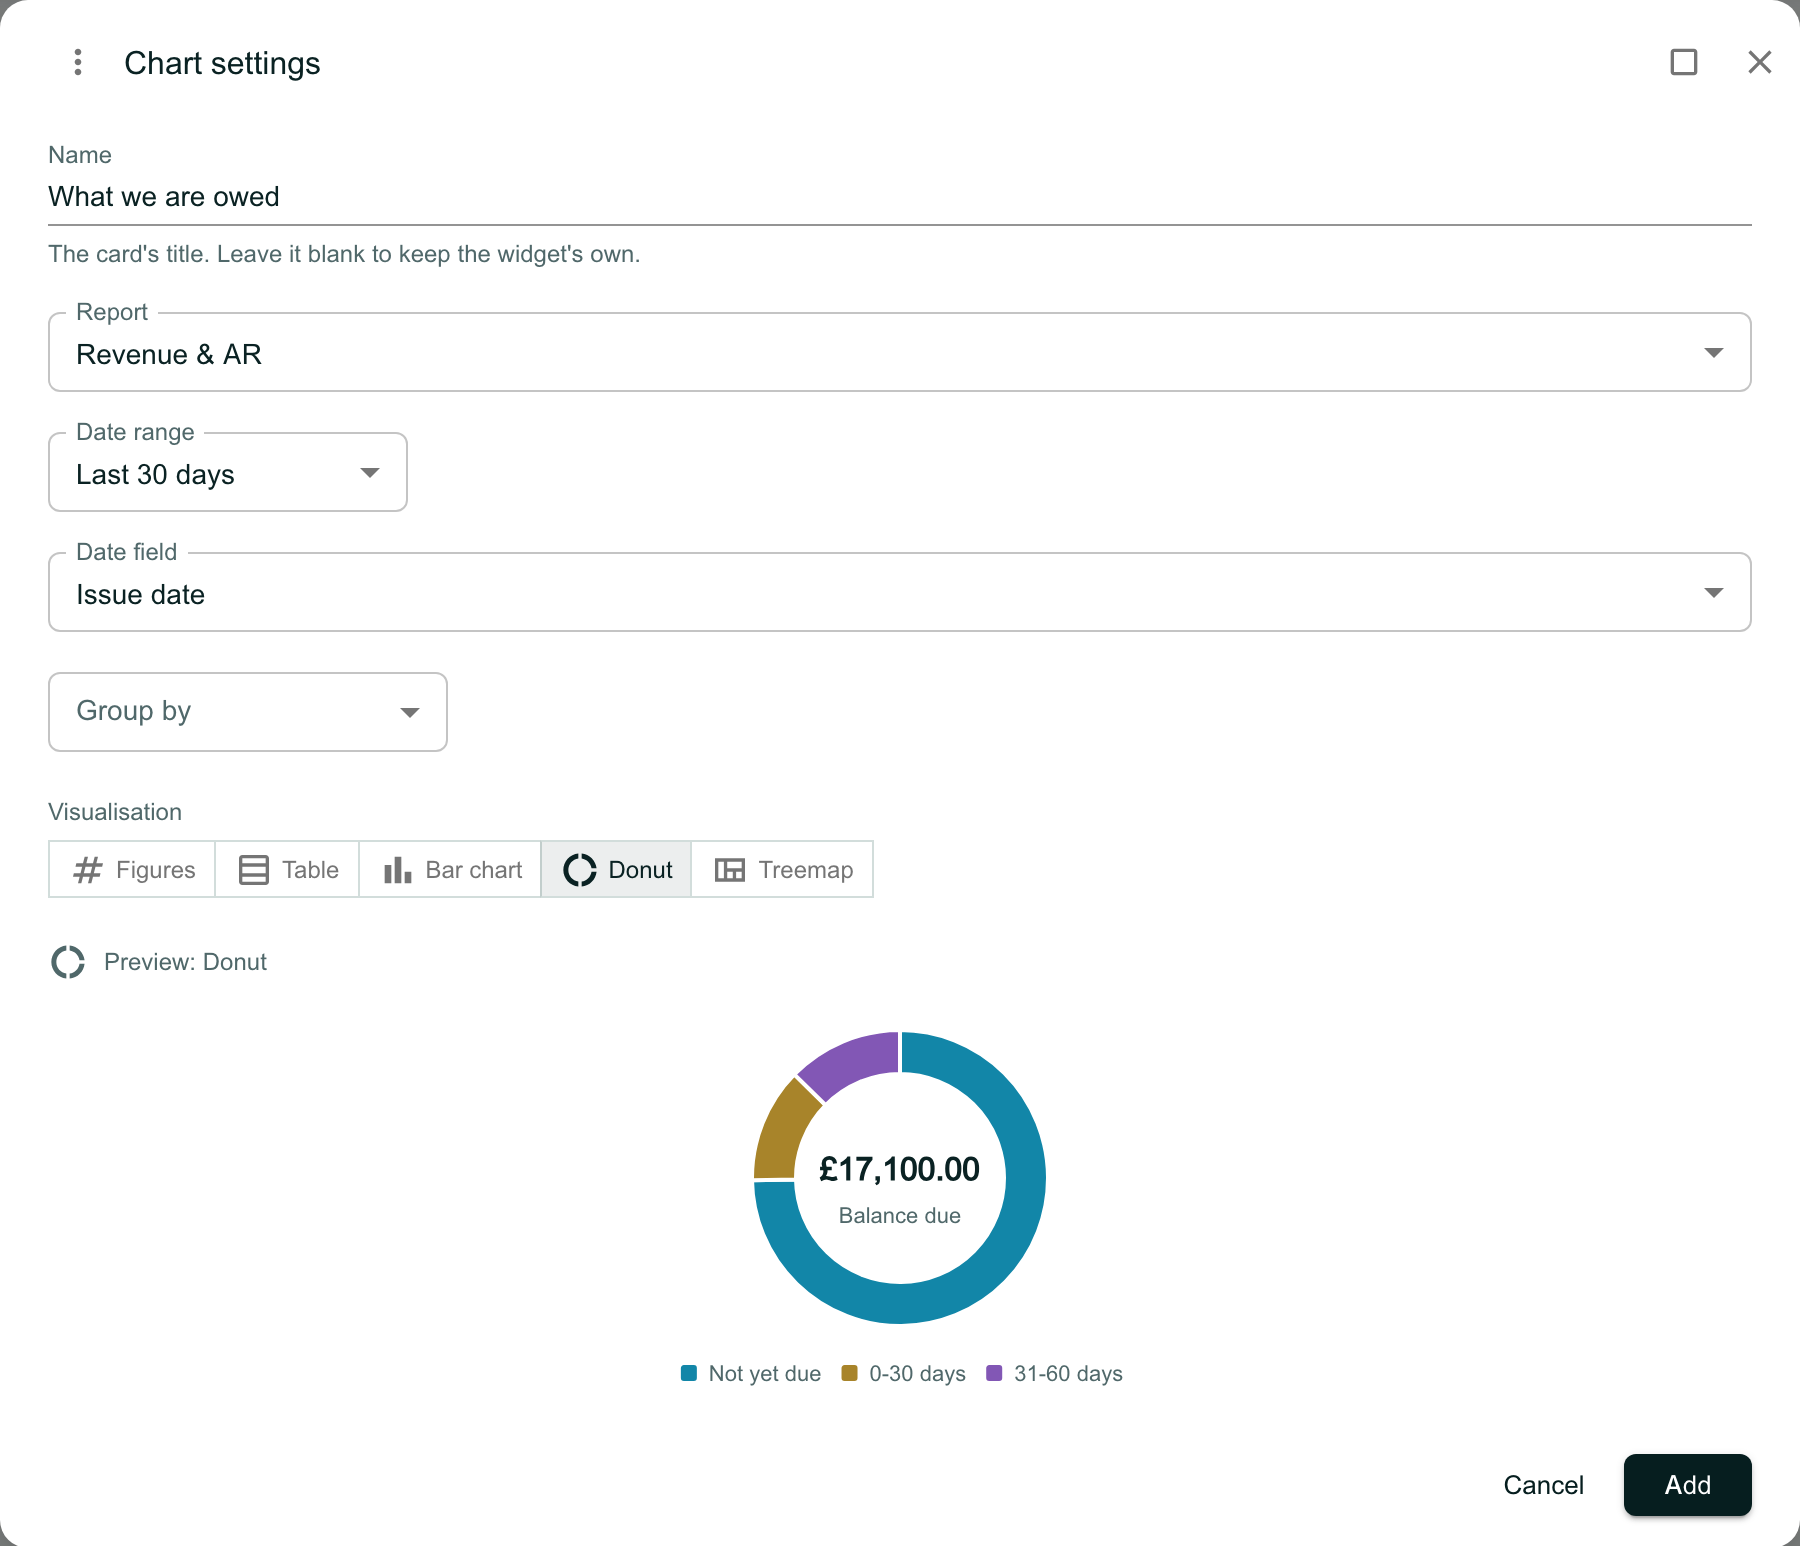
The Chart settings window. Name reads What we are owed, with the line The card’s title. Leave it blank to keep the widget’s own. Report is Revenue & AR, Date range Last 30 days, Date field Issue date, and Group by is empty. Visualisation offers Figures, Table, Bar chart, Donut (selected) and Treemap. Preview: Donut shows a ring with £17,100.00 Balance due at its centre, split into Not yet due, 0-30 days and 31-60 days. Cancel and Add are at the foot.

Choose how it is drawn

Visualisation offers only the charts the figures fit. A donut, for example, needs the figures split one way only.

Here, grouping by Payer splits what is owed two ways, by payer and by age. Treemap is no longer offered, while Stacked bars, Stacked bars (100%) and Heat grid are. The donut you chose cannot draw it, so the preview shows stacked bars, with a line saying why. Set Group by back to None to keep the donut.
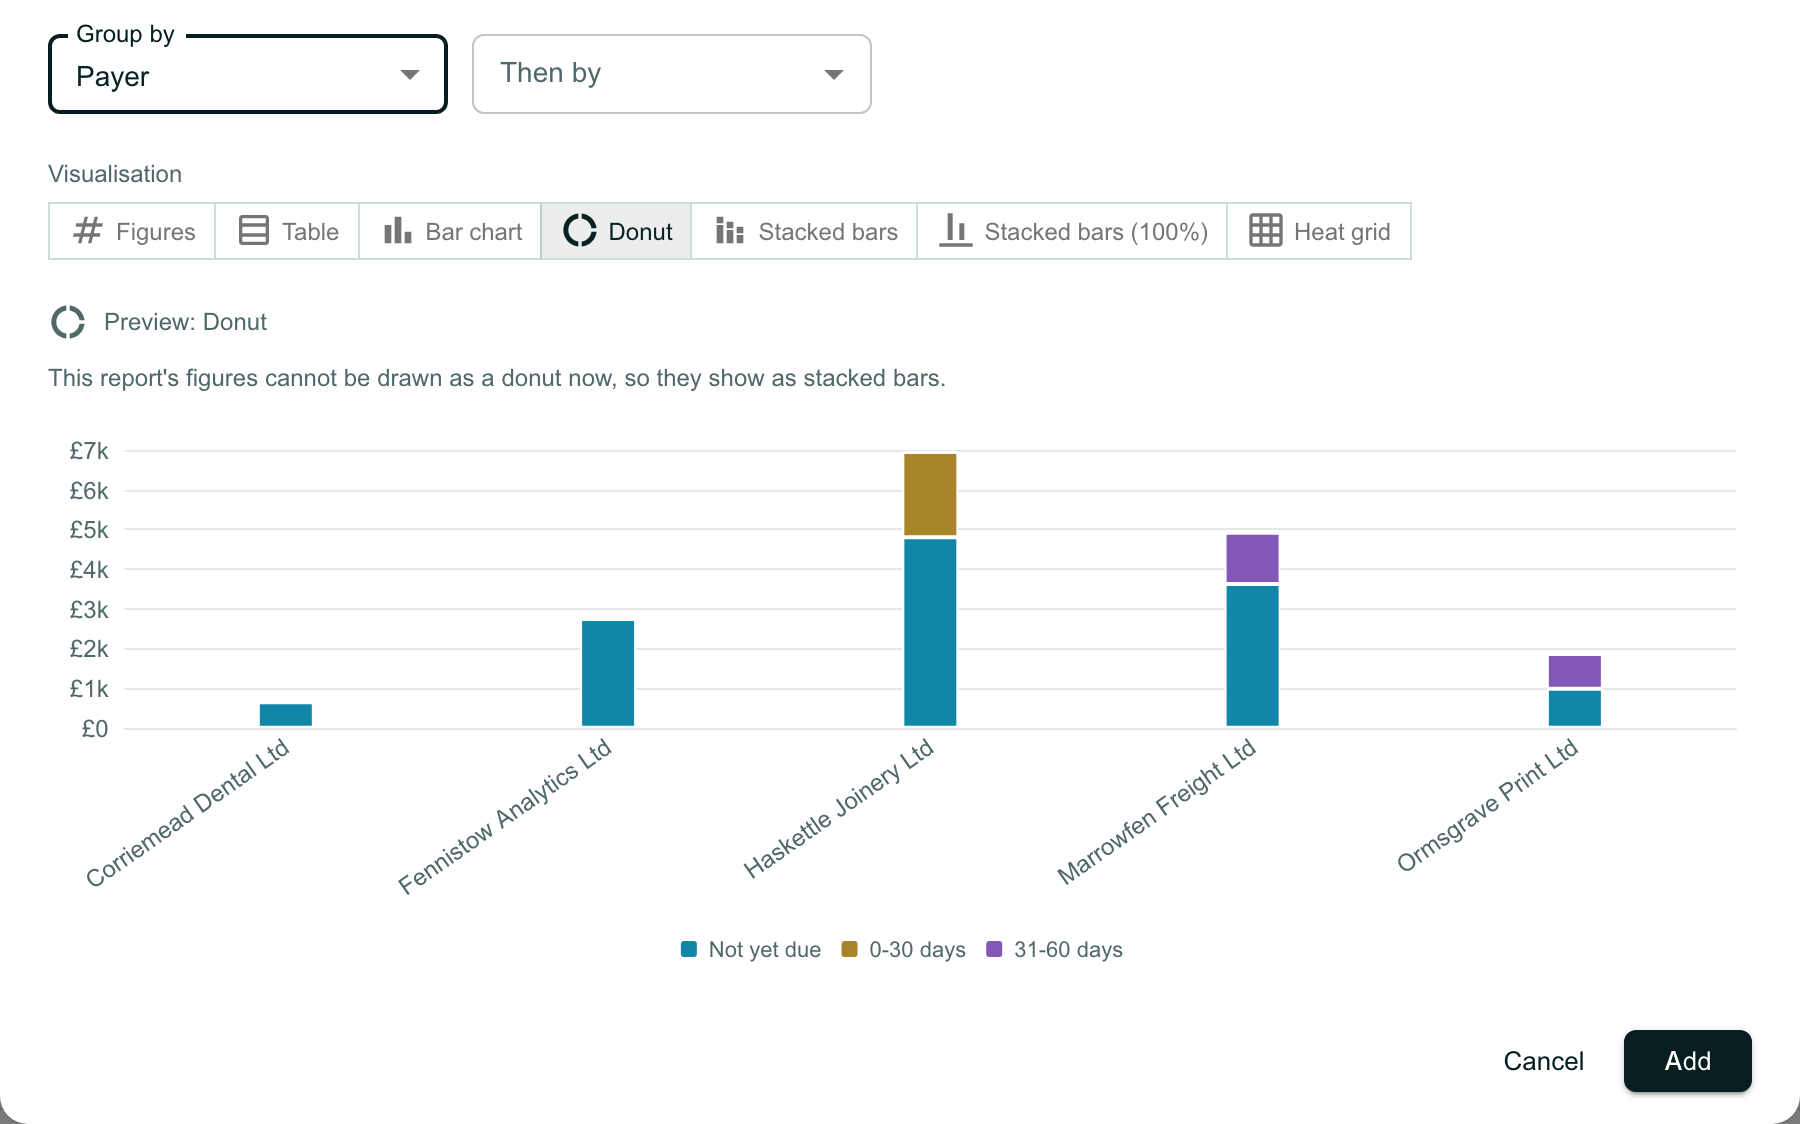
The same settings with Group by set to Payer and an empty Then by. Visualisation now offers Figures, Table, Bar chart, Donut, Stacked bars, Stacked bars (100%) and Heat grid, without Treemap. Under Preview: Donut, the line This report’s figures cannot be drawn as a donut now, so they show as stacked bars, above a stacked bar of the balance due for each payer, from £0 to £7k, split into Not yet due, 0-30 days and 31-60 days.

Click Add

Click Add. The card shows the name you gave it and the window it covers.
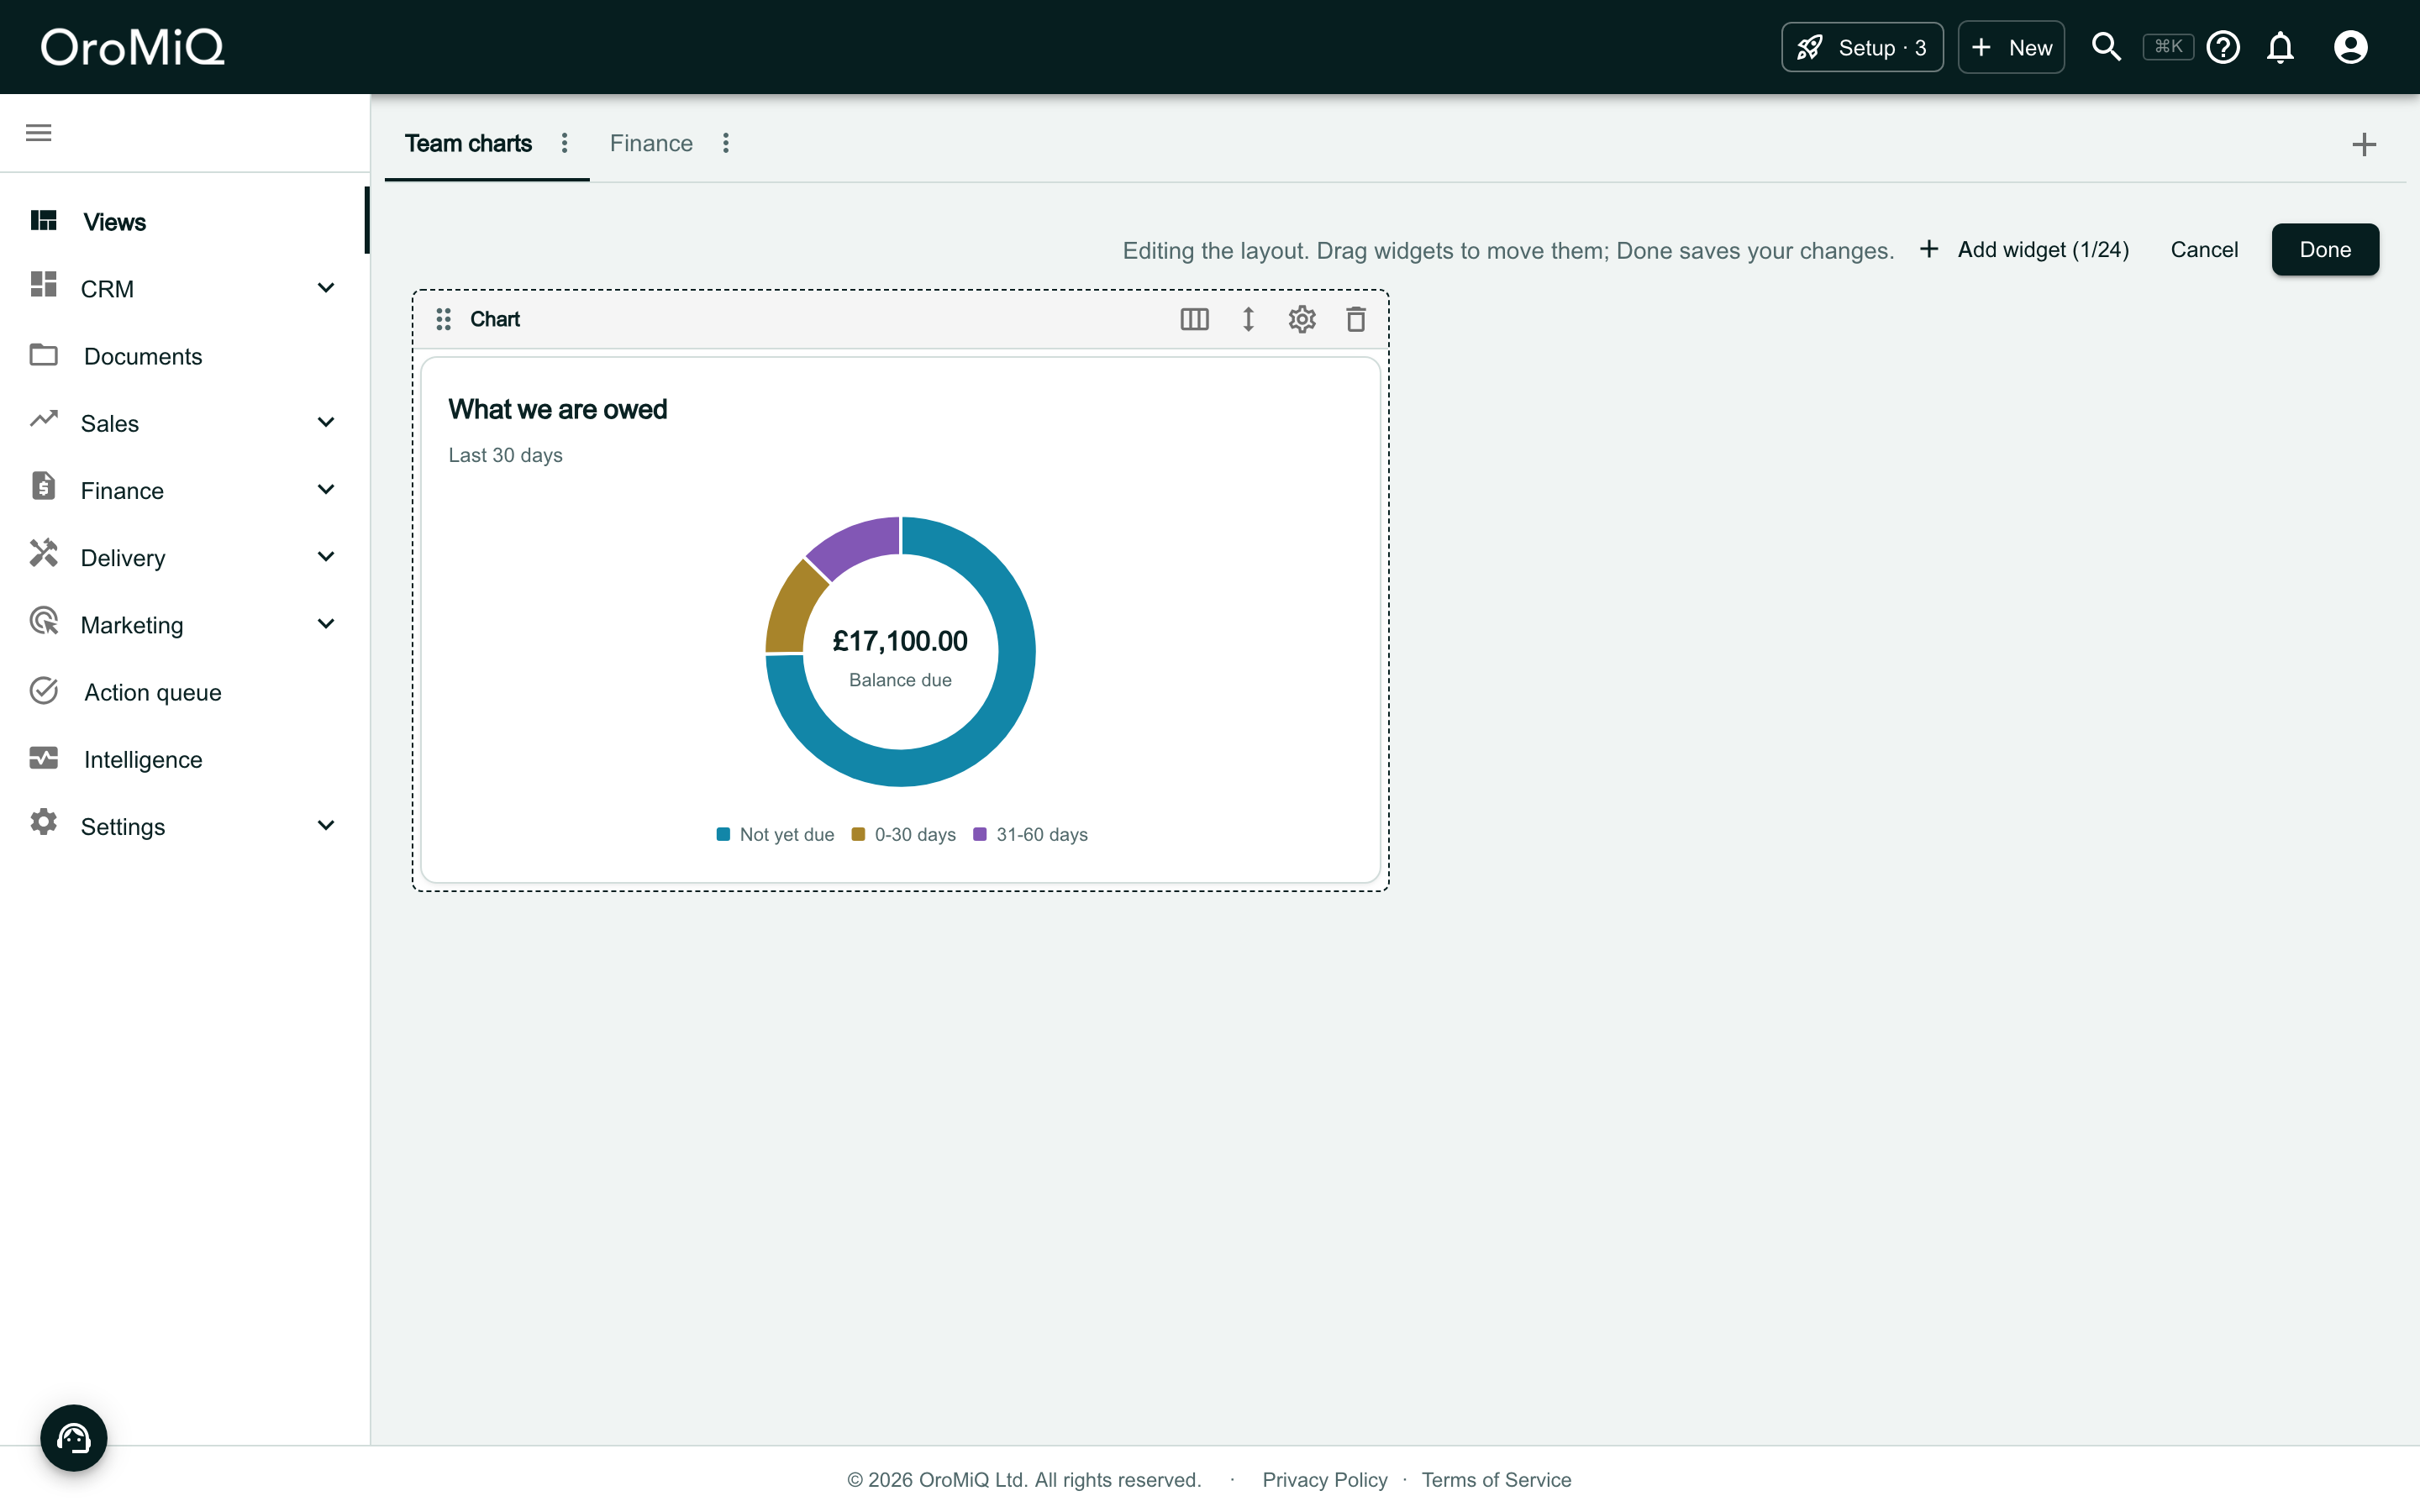
The Team charts dashboard in Edit layout, now reading Add widget (1/24). A widget frame headed Chart, with buttons for width, height, settings and remove, holds a card titled What we are owed, Last 30 days, with the donut of £17,100.00 balance due.

Click Done to save

Click Done. The layout is saved with the new chart. To change the chart later, click the gear icon on its card.
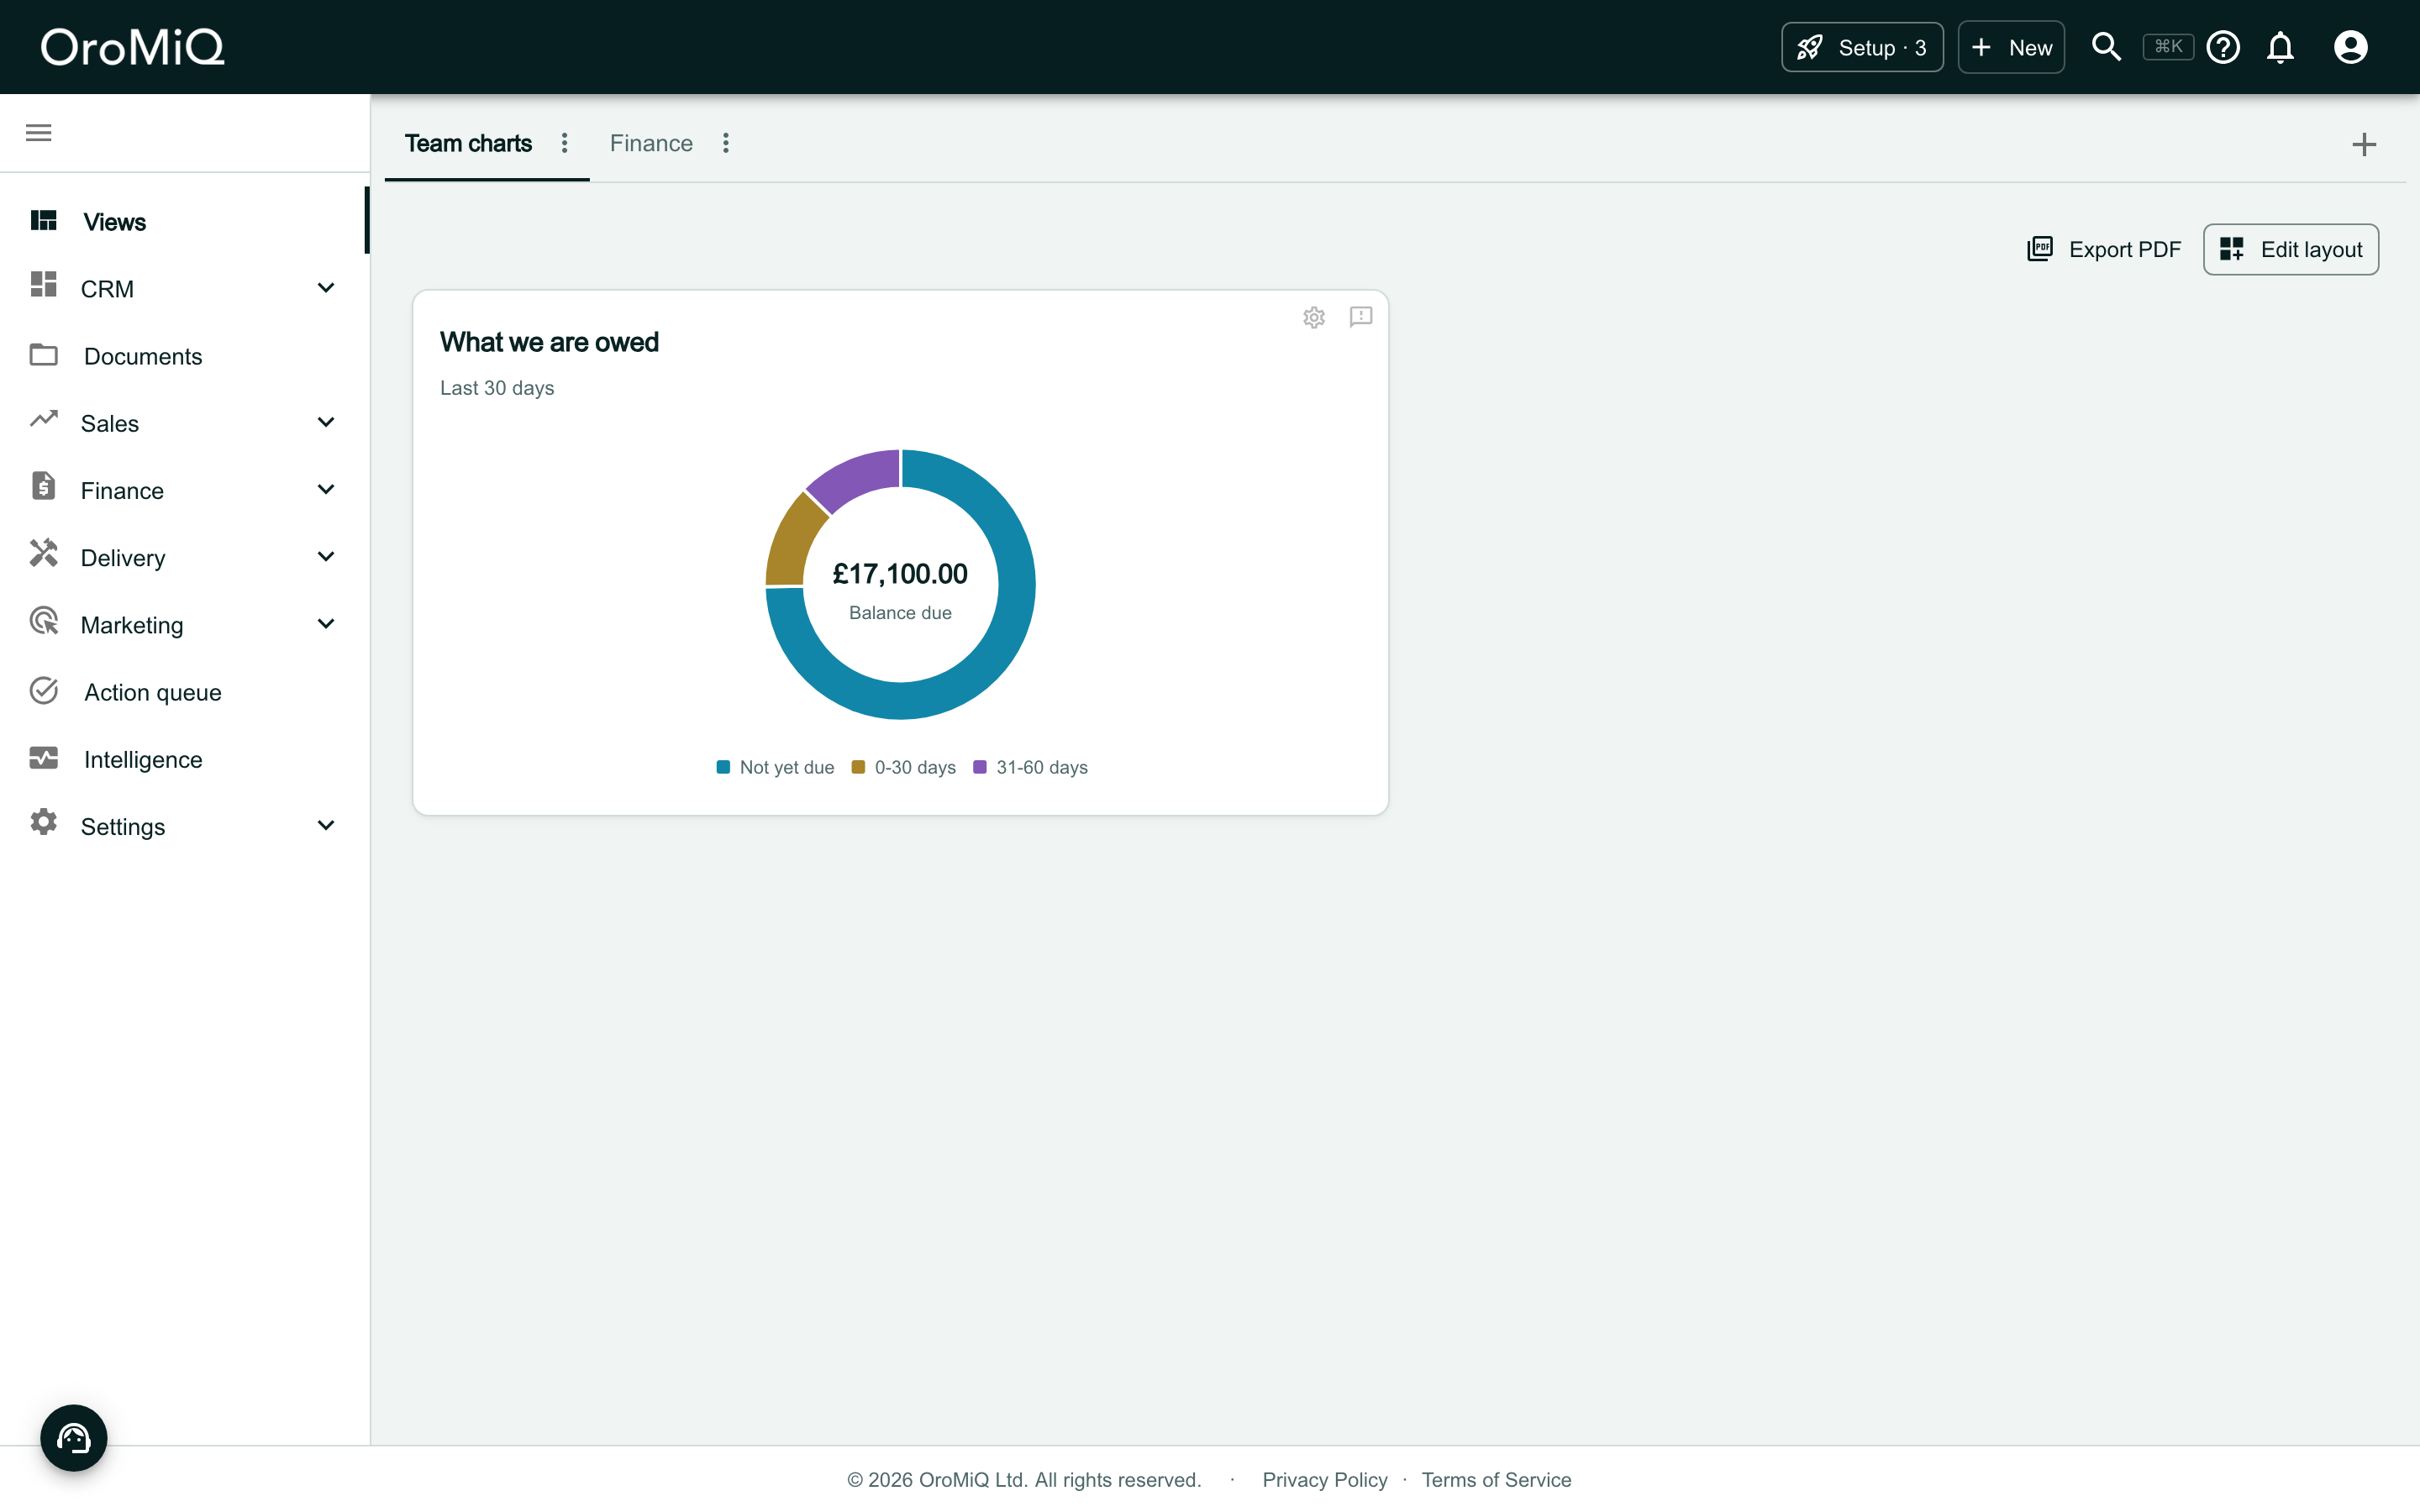
The Team charts dashboard out of Edit layout, with Export PDF and Edit layout above it, and the card What we are owed showing its donut.

Change your mind with Cancel

A chart goes on the dashboard as soon as you click Choose. If you do not want it after all, click Cancel in its settings: the chart is taken off again.

The funnel here is Pipeline funnel, under Funnel and Sales. It counts the deals created in the window that reached each stage, so each step after the first shows its share of the step before: of 12 deals, 9 (75%) reached Proposed.
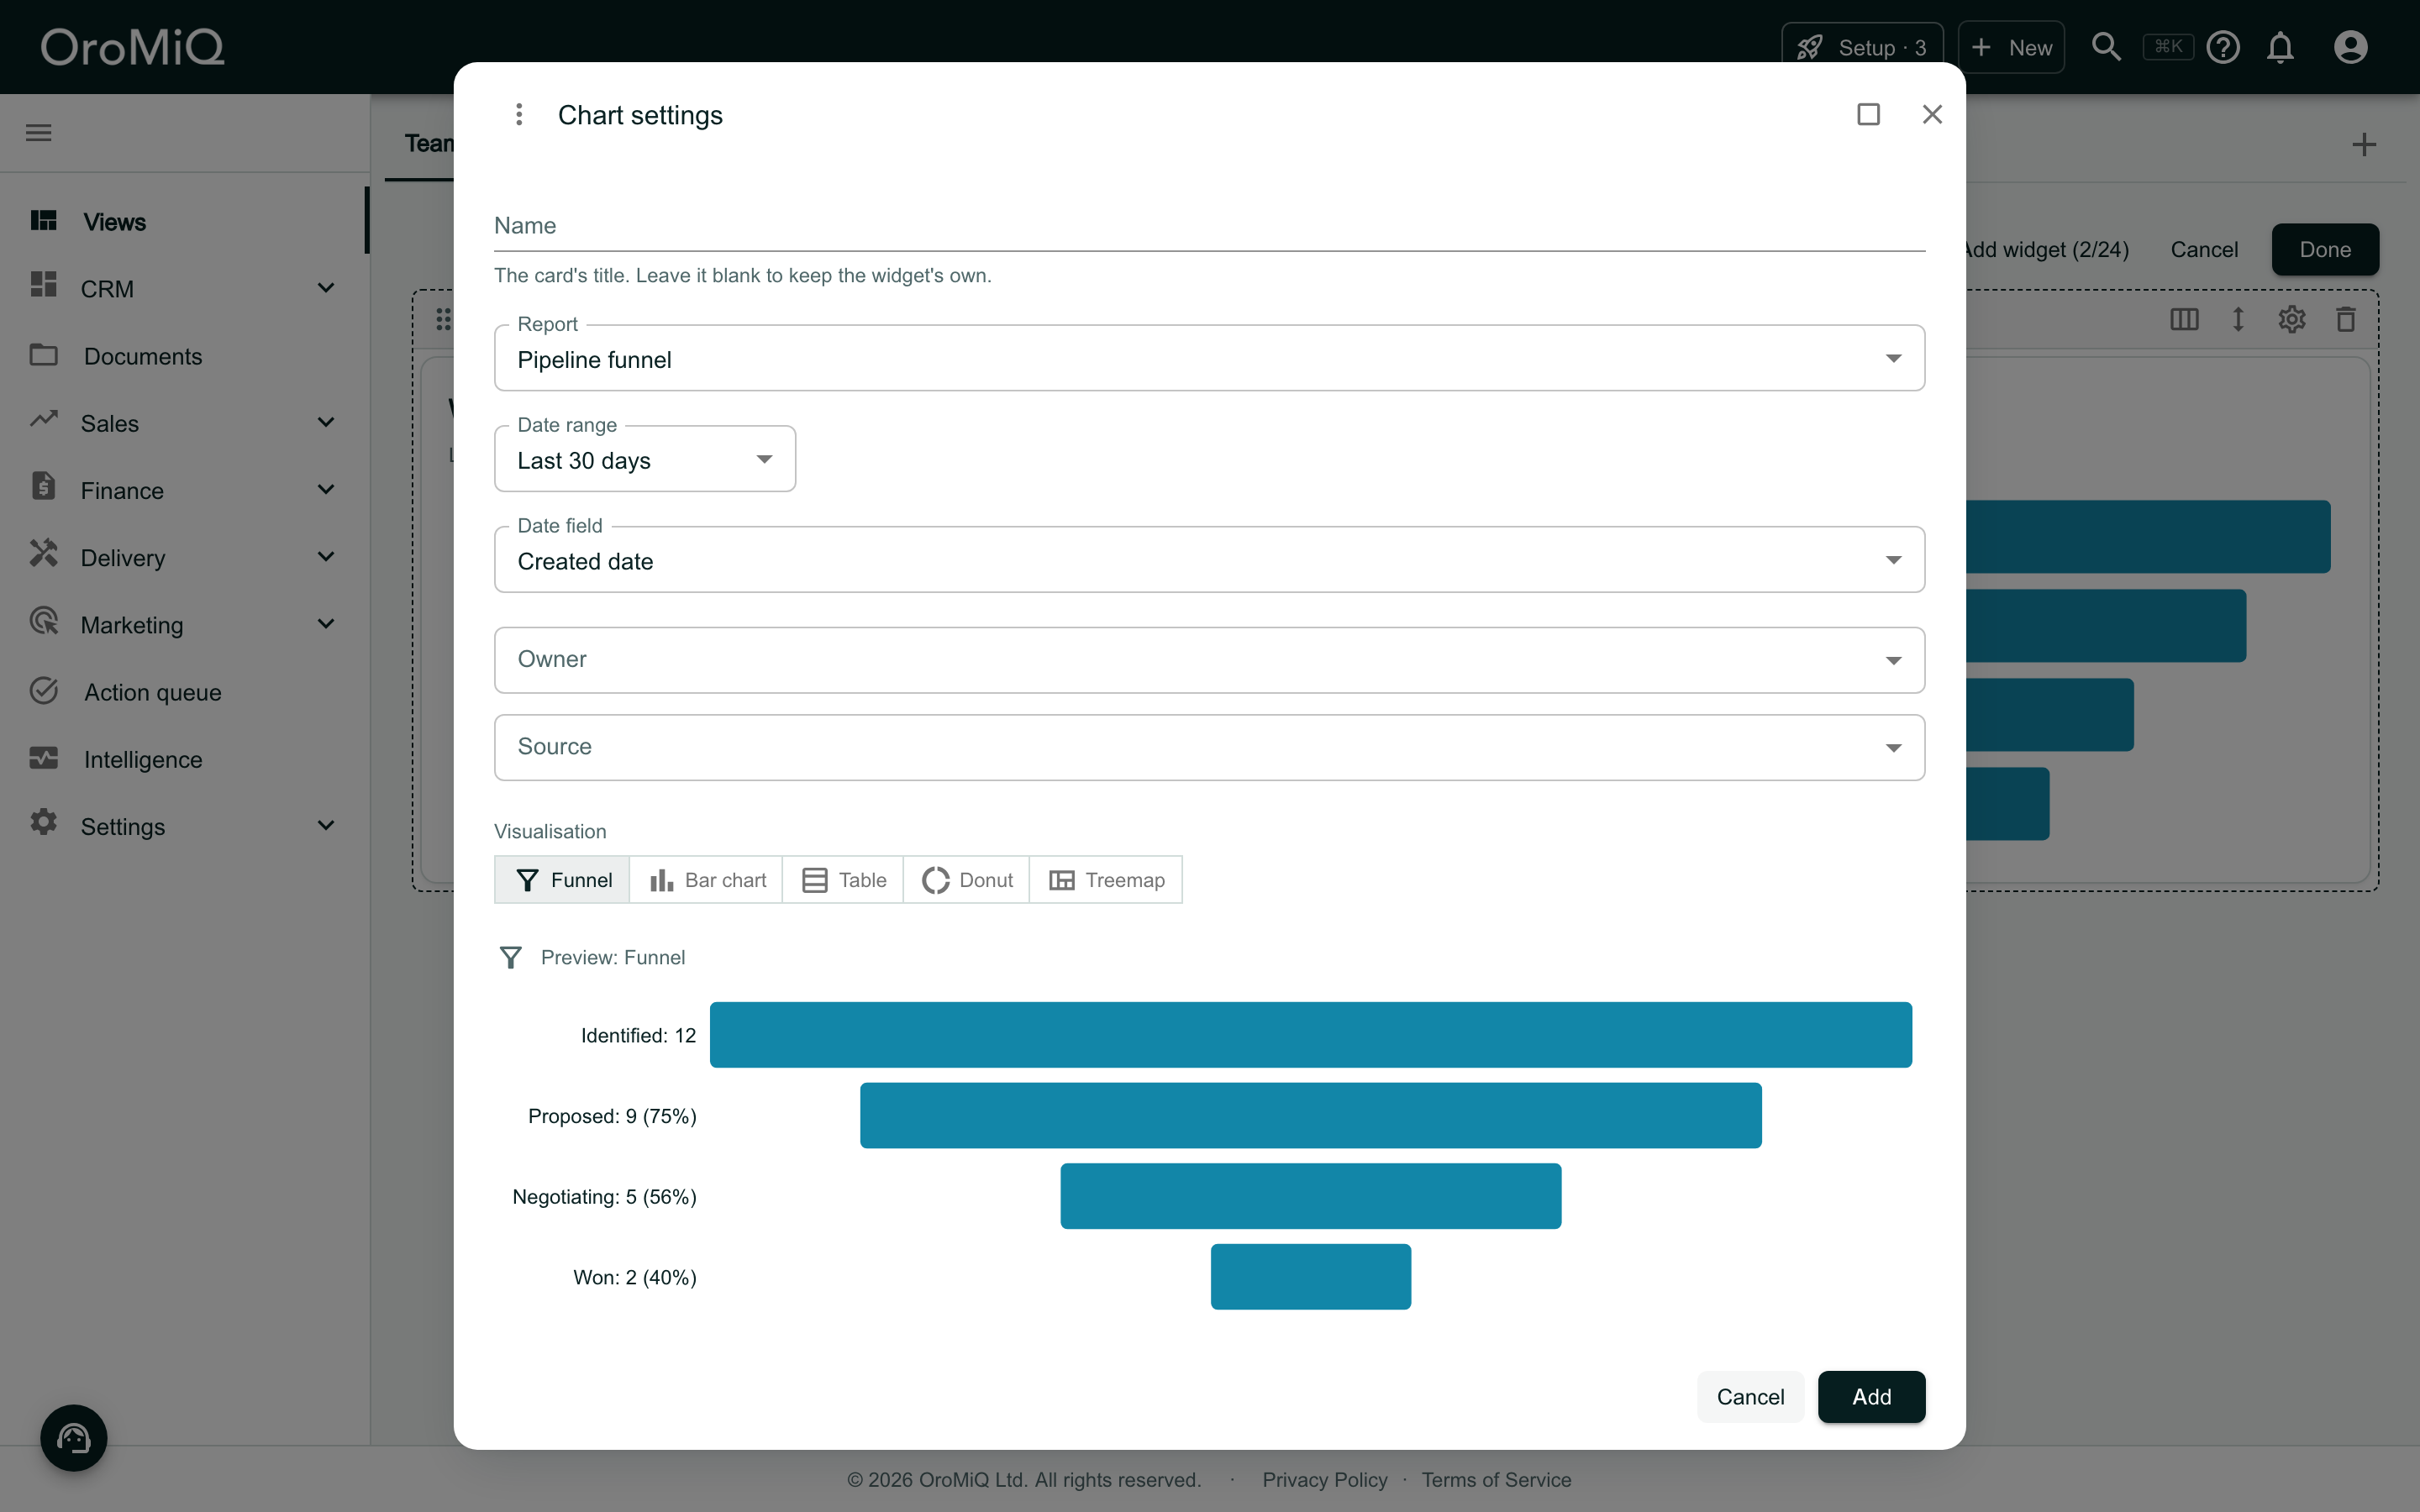
Chart settings for a Funnel of the Pipeline funnel report over the last 30 days, by Created date, with Owner and Source filters. The preview draws each stage as a bar centred on one line, as wide as its figure, with the stage, its figure and its share of the step before on the left: Identified: 12, Proposed: 9 (75%), Negotiating: 5 (56%) and Won: 2 (40%). The pointer is on Cancel, beside Add. Behind the window the dashboard reads Add widget (2/24).

Example: when calls and emails happen

Choose Heat grid and Activity volume

In Edit layout, click Add widget, then Heat grid. Under Activity, click Choose beside Activity volume.
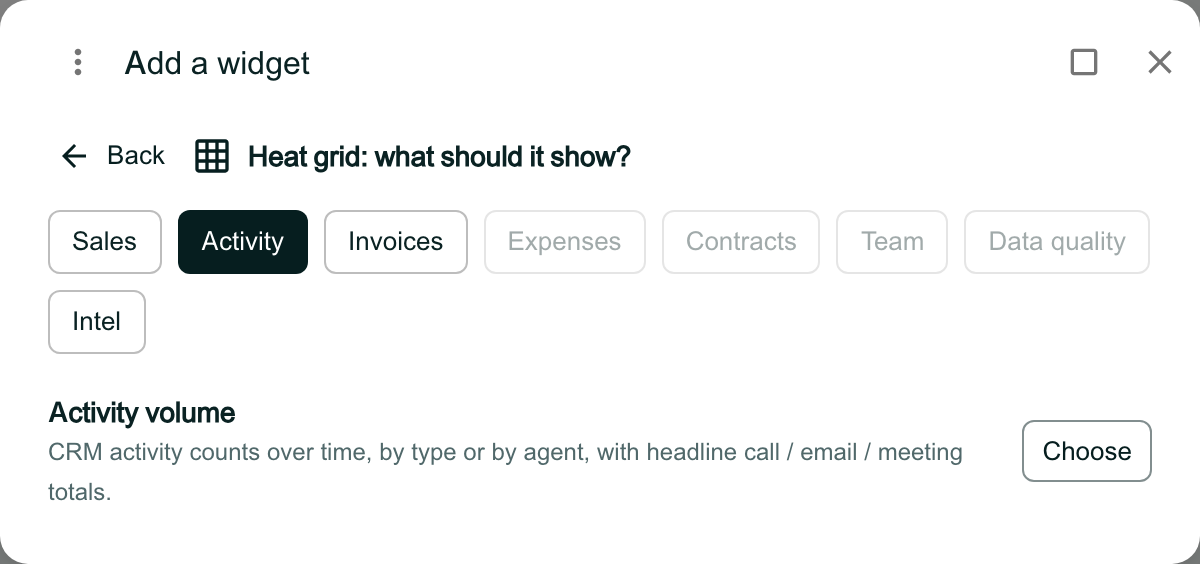
Add a widget reading Heat grid: what should it show?, with Activity selected and Sales, Invoices and Intel available; Expenses, Contracts, Team and Data quality are greyed out. Under Activity: Activity volume, CRM activity counts over time, by type or by agent, with headline call / email / meeting totals, and Choose.

Check the grouping

A heat grid needs two groupings, so the chart starts as Day of the week, then Hour of the day, over the last 90 days. The filters below it, Type, Agent and Account type, narrow what is counted.

Click Add, then Done.
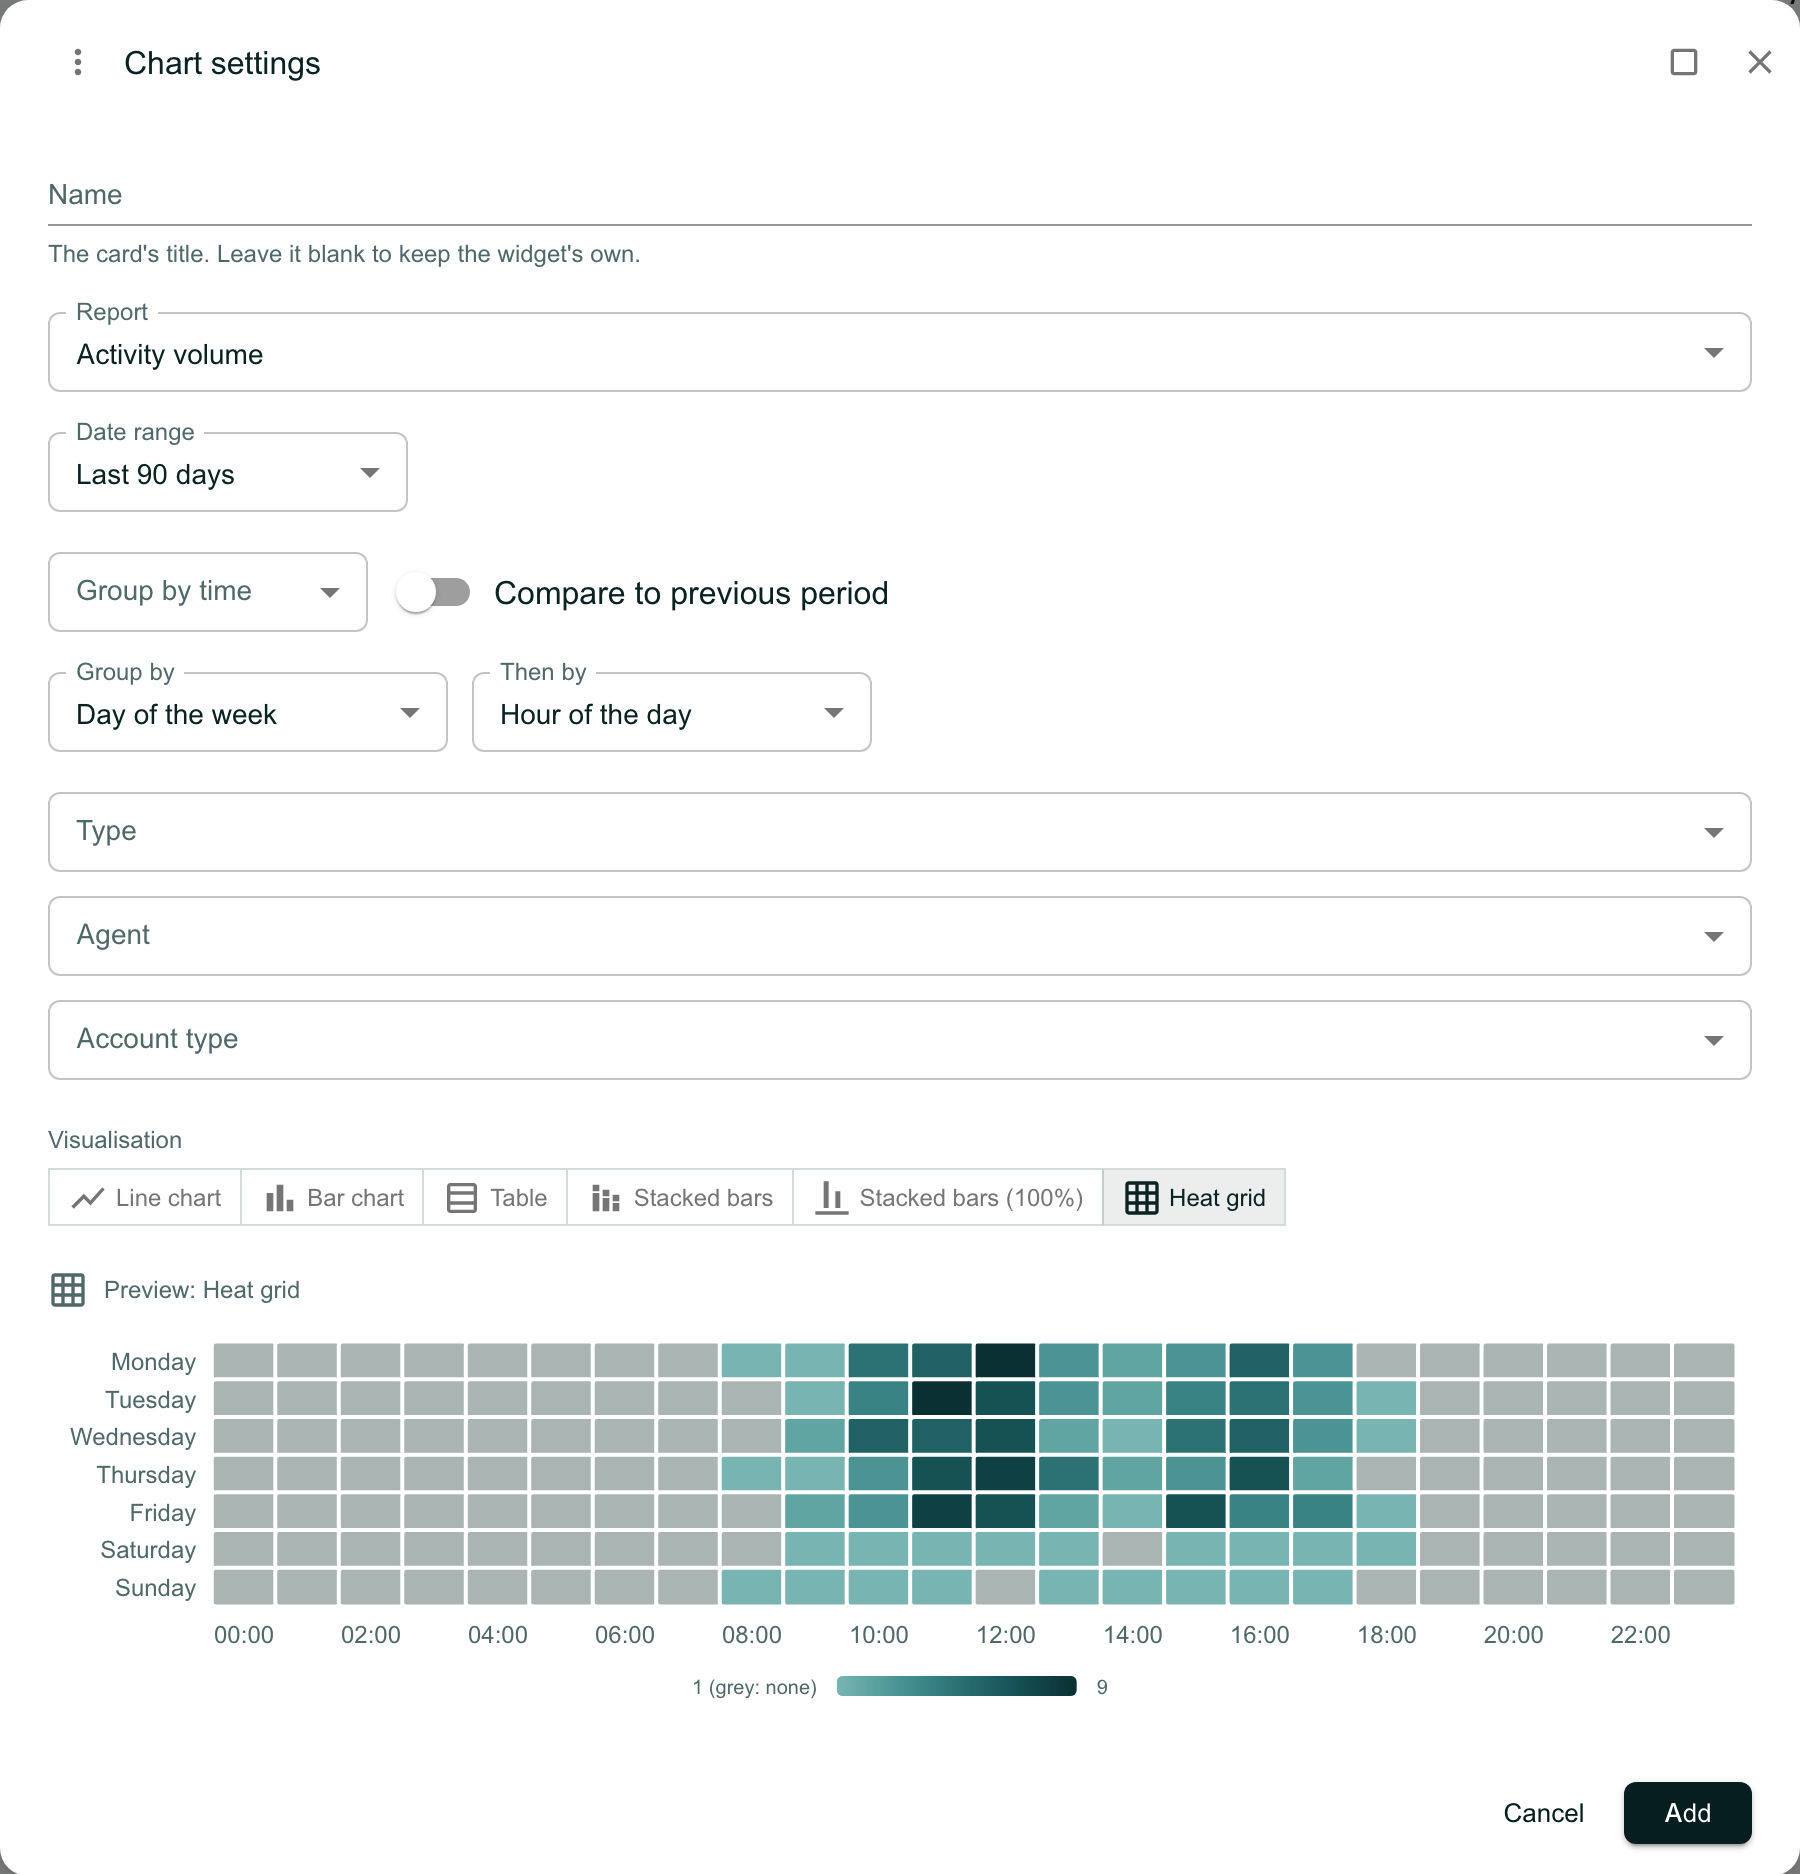
Chart settings for Activity volume over the last 90 days, grouped by Day of the week then by Hour of the day, with Type, Agent and Account type filters. Visualisation offers Line chart, Bar chart, Table, Stacked bars, Stacked bars (100%) and Heat grid (selected). The preview is a grid of the days Monday to Sunday against the hours 00:00 to 23:00, darker where there was more activity, with a scale from 1 (grey: none) to 9.

Read the heat grid

Each square is one hour on one day of the week. The darker the square, the more calls, emails and meetings were logged then; a grey square means none. Hours are UK time.
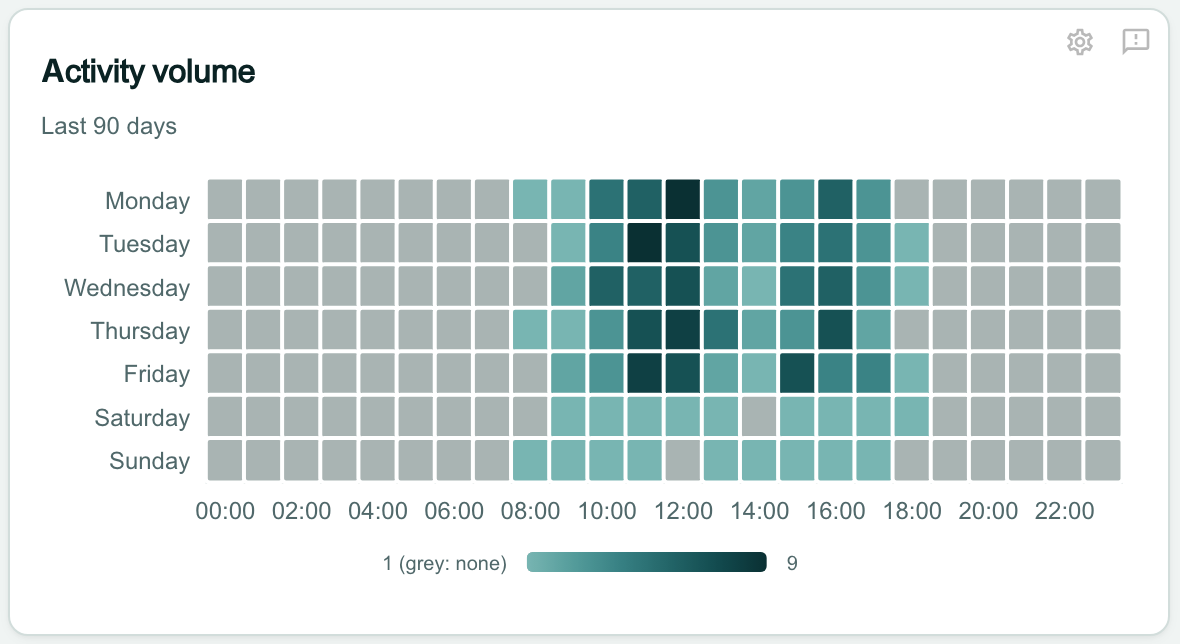
The Activity volume card, Last 90 days: a grid of Monday to Sunday by hour of the day. The weekday cells from about 09:00 to 17:00 are the darkest, the weekend cells lighter, and the night hours grey. A scale under the grid runs from 1 (grey: none) to 9.

Example: big deals that have gone stale

Choose Scatter and Open deals

Click Add widget, then Scatter. Under Sales, click Choose beside Open deals.
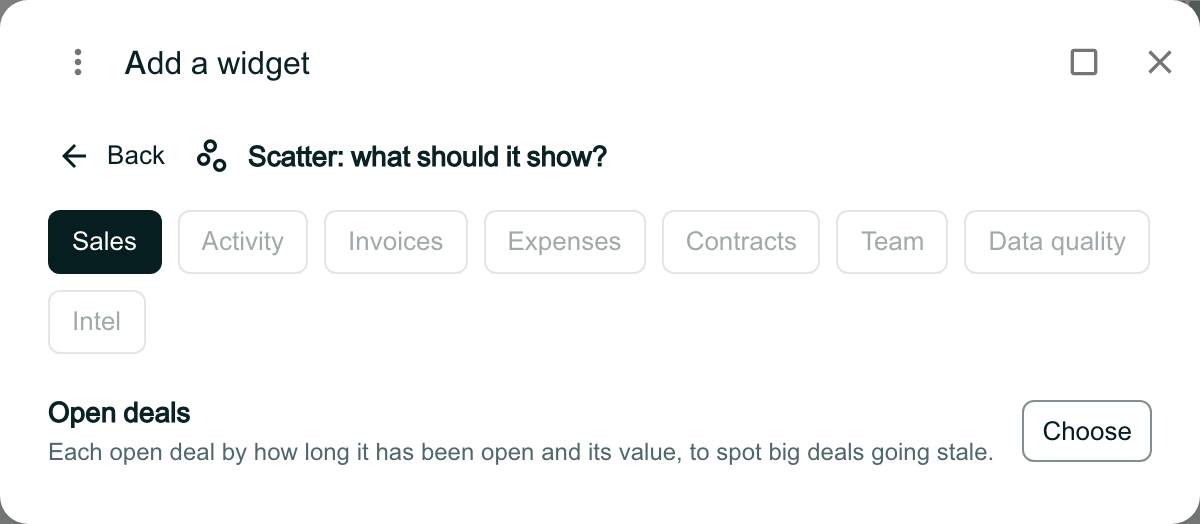
Add a widget reading Scatter: what should it show?, with Sales selected and every other chip greyed out. Under Sales: Open deals, Each open deal by how long it has been open and its value, to spot big deals going stale, and Choose.

Read the scatter

A scatter starts with the deals created in the Last 12 months, so the ones open for months are included. Click Add, then Done.

Each dot is an open deal, coloured by stage. The further right, the longer it has been open; the higher, the more it is worth. The big deals that have gone stale sit top right.
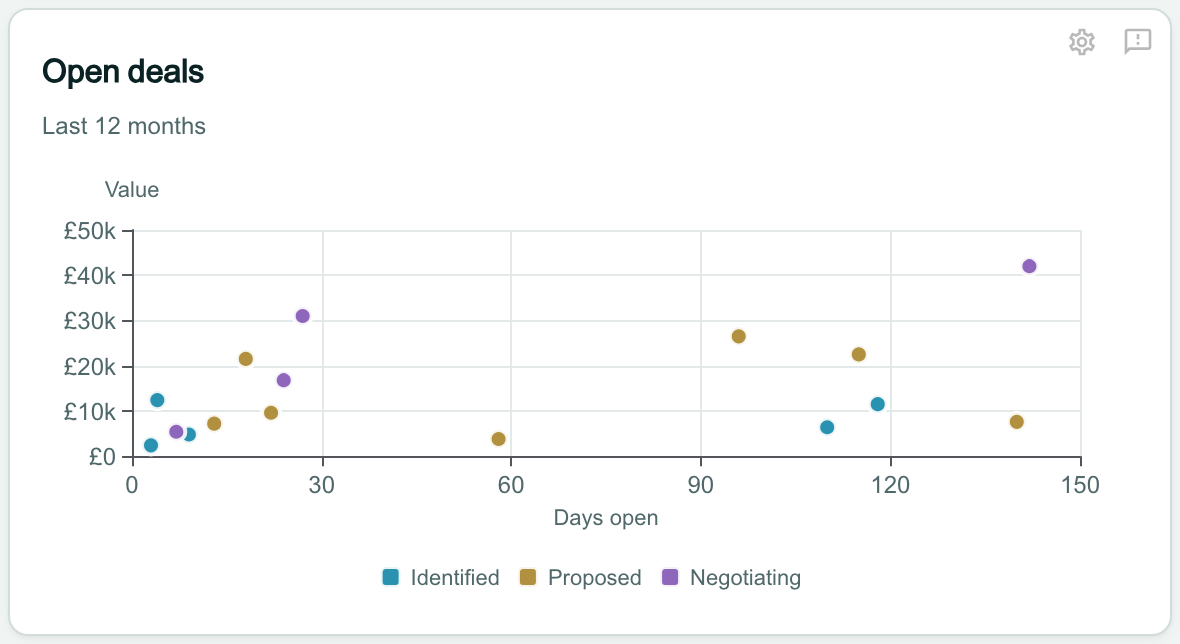
The Open deals card, Last 12 months: a scatter of Value from £0 to £50k against Days open from 0 to 150, with a key for Identified, Proposed and Negotiating. Most deals sit under 30 days and £35k, a few have been open from about 95 to 140 days, and one negotiating deal of about £42k, open about 140 days, sits at the top right.

Example: how your pipeline moved

Draw how deals moved with Flow

Click Add widget, then Flow. Under Sales, click Choose beside Deal flow. Click Add, then Done.

The flow follows each deal’s moves from one stage to the next over the Last 90 days, read from the deal’s history. The wider a band, the more deals made that move; Lost is where deals dropped out.

A flow only runs forward. A line under it counts the moves back to an earlier stage and the closed deals that were reopened, which it does not draw.
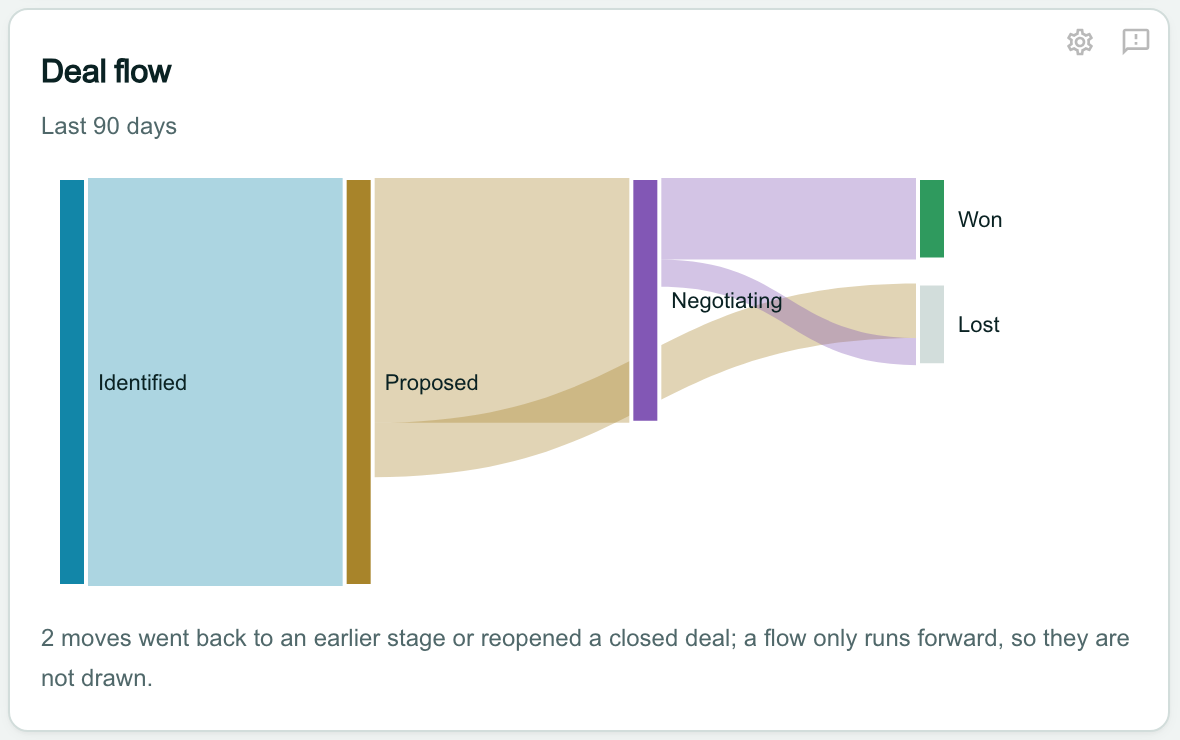
The Deal flow card, Last 90 days: bands run from Identified to Proposed, from Proposed to Negotiating and to Lost, and from Negotiating to Won and to Lost, each as wide as the number of deals that made the move. Under it: 2 moves went back to an earlier stage or reopened a closed deal; a flow only runs forward, so they are not drawn.

Show what changed your pipeline with Waterfall

Click Add widget, then Waterfall. Under Sales, click Choose beside Pipeline movement. Click Add, then Done.

The first bar is the value of your open deals at the start of the last 90 days, and the last bar their value at the end. The bars between show what added to it (New deals, Reopened) and what took from it (Won and Lost deals leave the open pipeline), each with its amount.

Value changes adds up the edits to open deals’ values. A line under the chart says they are counted from 18 November 2026, when OroMiQ began recording them.
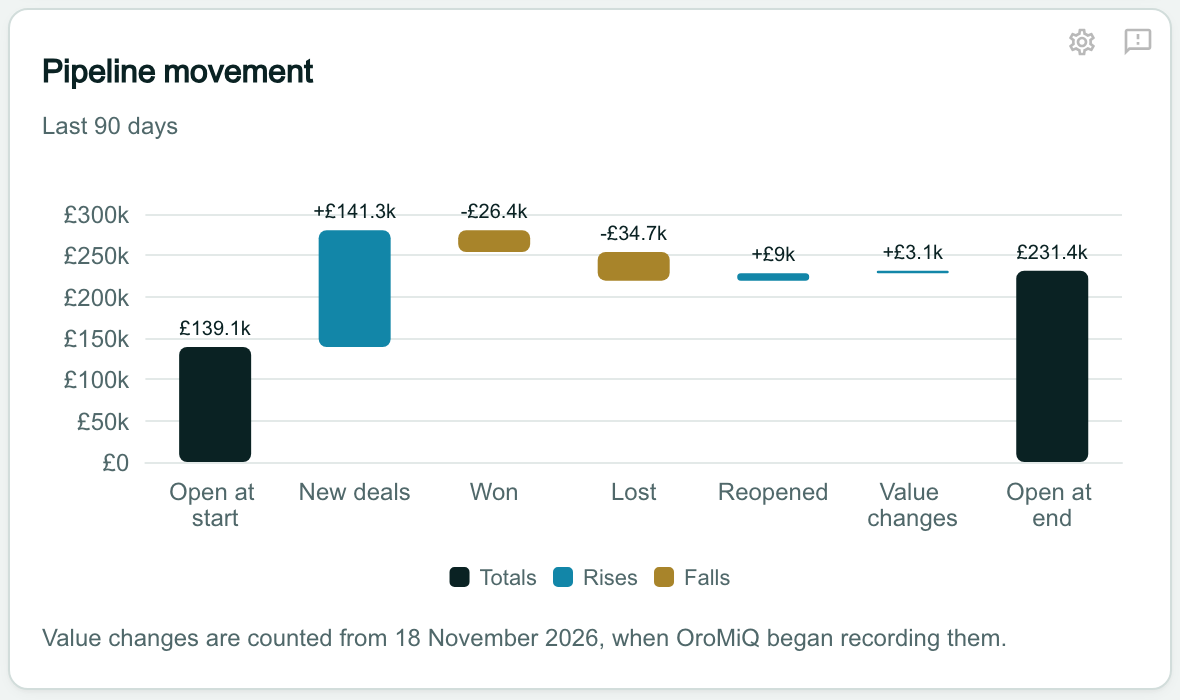
The Pipeline movement card, Last 90 days: a waterfall from Open at start £139.1k, through New deals +£141.3k, Won -£26.4k, Lost -£34.7k, Reopened +£9k and Value changes +£3.1k, to Open at end £231.4k, on a scale from £0 to £300k, with a key for Totals, Rises and Falls. Under it: Value changes are counted from 18 November 2026, when OroMiQ began recording them.

Example: when your contracts run

Show your contracts on a Timeline

Click Add widget, then Timeline. Under Contracts, click Choose beside Contract renewals. Click Add, then Done.

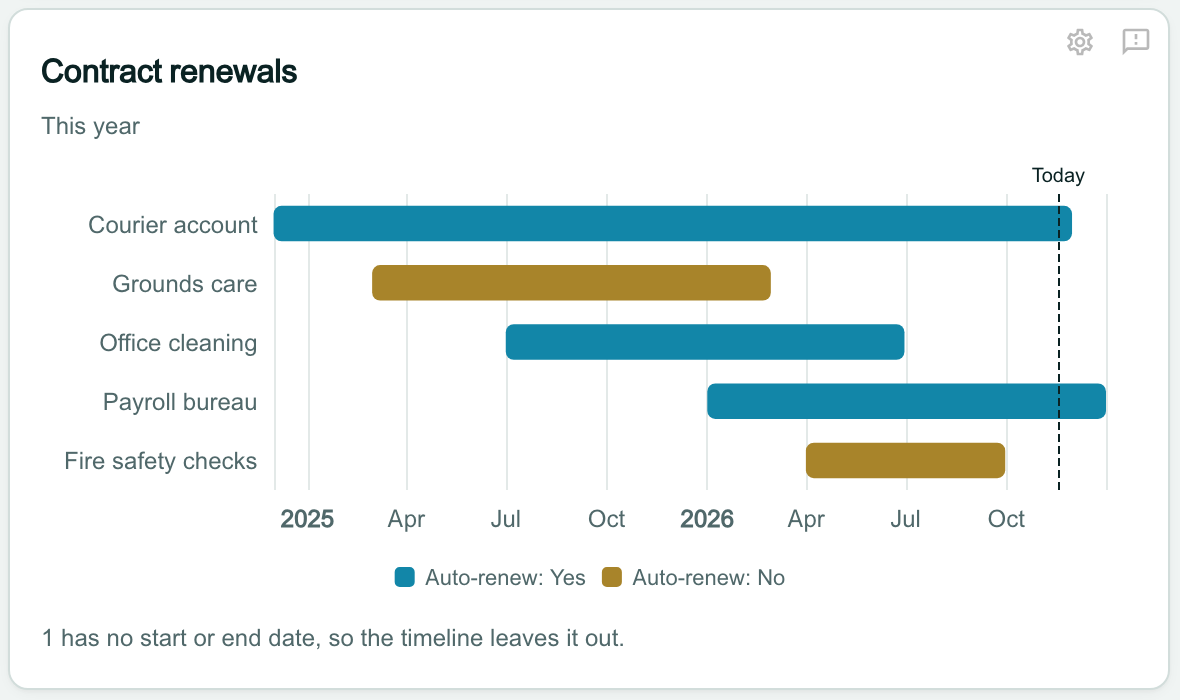
Each contract ending This year is a bar from its start date to its end date, longest first, up to 15. The colour shows whether it renews automatically, and the dashed line marks today.

A contract with no start or end date cannot be drawn: a line under the chart says how many were left out.

Note
Contract renewals is offered only when contracts are switched on for your workspace.
The Contract renewals card, This year: bars for Courier account, Grounds care, Office cleaning, Payroll bureau and Fire safety checks along a time axis from the start of 2025 to the end of 2026, each coloured Auto-renew: Yes or Auto-renew: No, with a dashed line marked Today in November 2026. Under it: 1 has no start or end date, so the timeline leaves it out.

Intel and Lists

Chart your data layers with Intel

Intel charts what your data layers know. Choosing one adds the matching Intelligence widget (Breakdown, Spread, Compare, Trend, Cross-tab, Map, Headline figures or Intel View), already set to draw as the chart you picked. Its settings open with Add in the same way.

Note
The Intel charts need a data layer switched on for your workspace. See Turn on a data layer and Use the chart widgets.
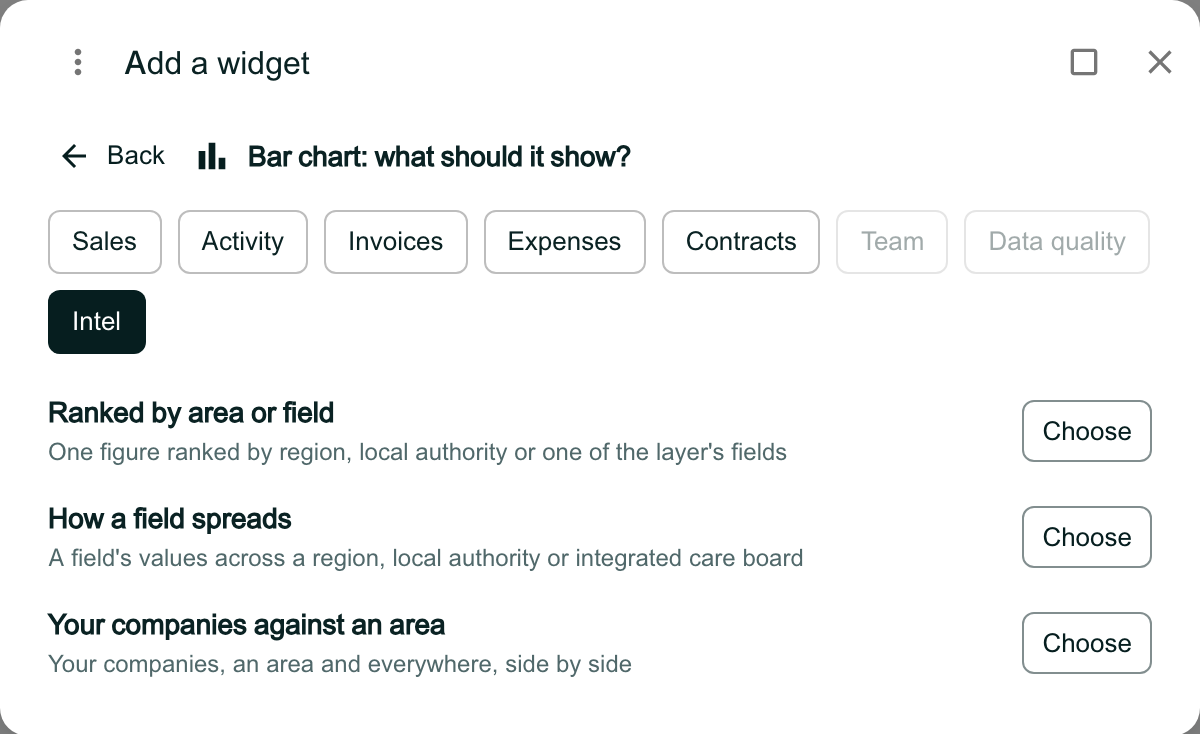
Add a widget reading Bar chart: what should it show?, with Intel selected. Under Intel: Ranked by area or field, One figure ranked by region, local authority or one of the layer’s fields; How a field spreads; and Your companies against an area, each with Choose.

Show a list View with Lists

Under Table, Lists adds the List widget: the first rows of one of your company or contact Views, with its columns. Its settings open, as for any chart, for you to pick the View.
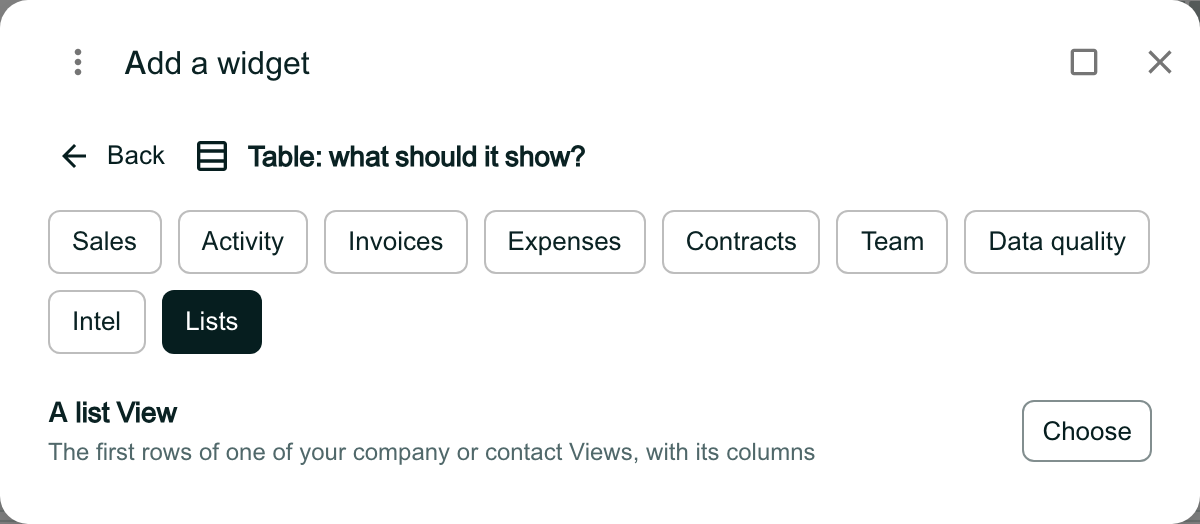
Add a widget reading Table: what should it show?, with Lists selected. Under Lists: A list View, The first rows of one of your company or contact Views, with its columns, and Choose.

Print the dashboard

Click Export PDF above the dashboard. Each chart prints as the same chart, under its name, with the dates it covers.
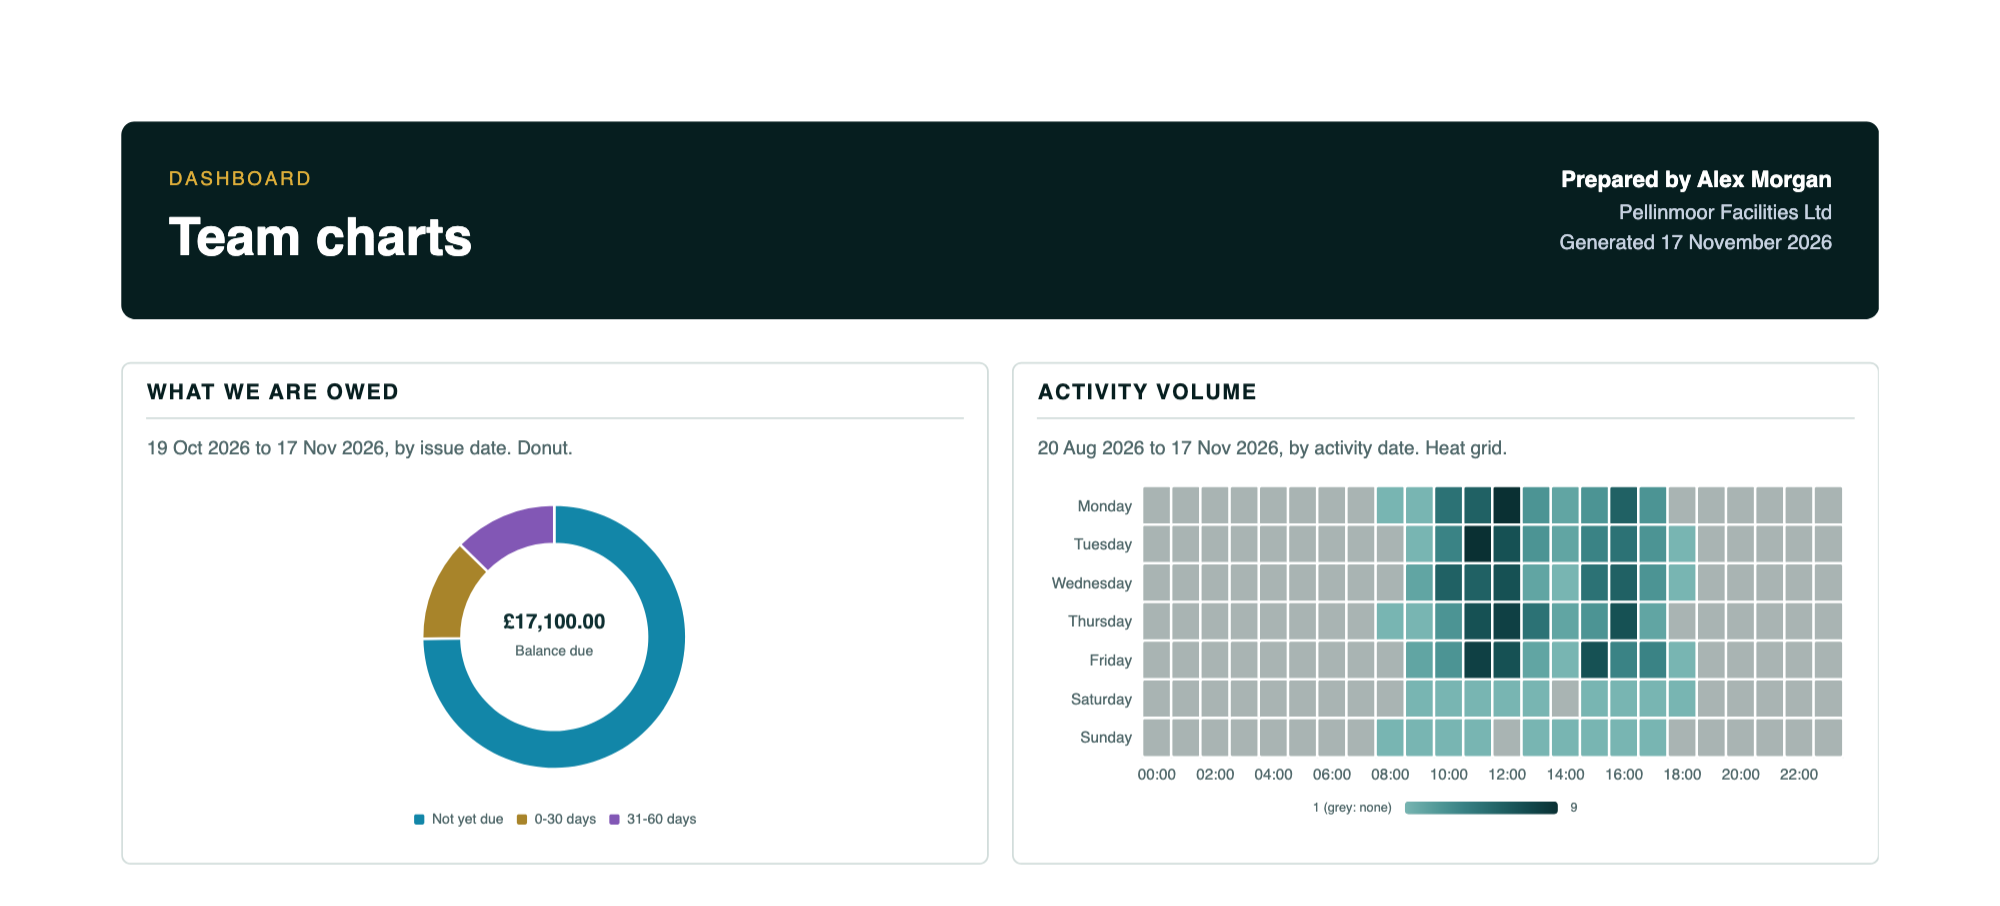
The top of the dashboard PDF: a dark band reading Dashboard, Team charts, Prepared by Alex Morgan, the workspace name and the day it was generated. Below it, the What we are owed donut with £17,100.00 Balance due at its centre and the Activity volume heat grid, each under its title with its dates and the kind of chart, such as by issue date. Donut.

Know why a chart shows as stacked bars

If a saved chart’s figures no longer fit the chart chosen for it, the card draws them in the nearest chart that fits, with a line saying so: stacked bars when the figures are split two ways, otherwise bars, or else a table. Nothing is lost.

Open the chart’s settings and choose a Visualisation that is offered, or change Group by so the figures fit again.
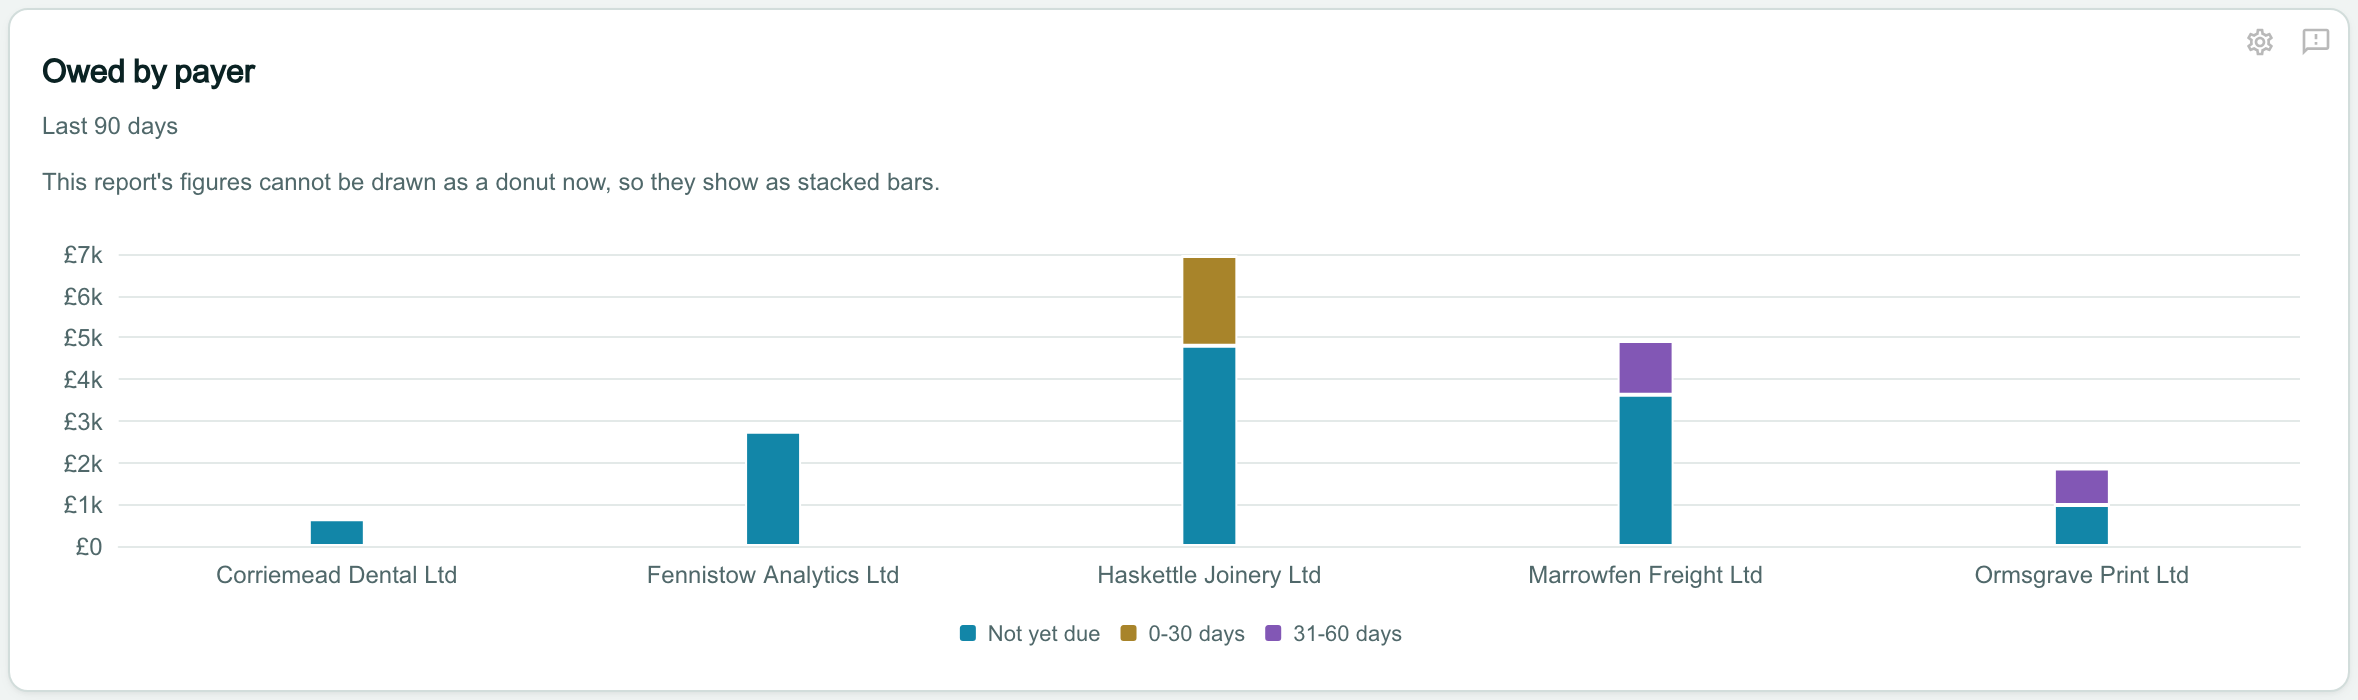
A card called Owed by payer, Last 90 days, with the line This report’s figures cannot be drawn as a donut now, so they show as stacked bars, above a stacked bar of the balance due for each payer, from £0 to £7k, split into Not yet due, 0-30 days and 31-60 days.