Getting started
Customise your Home dashboard and run your first report
Read your Home dashboard
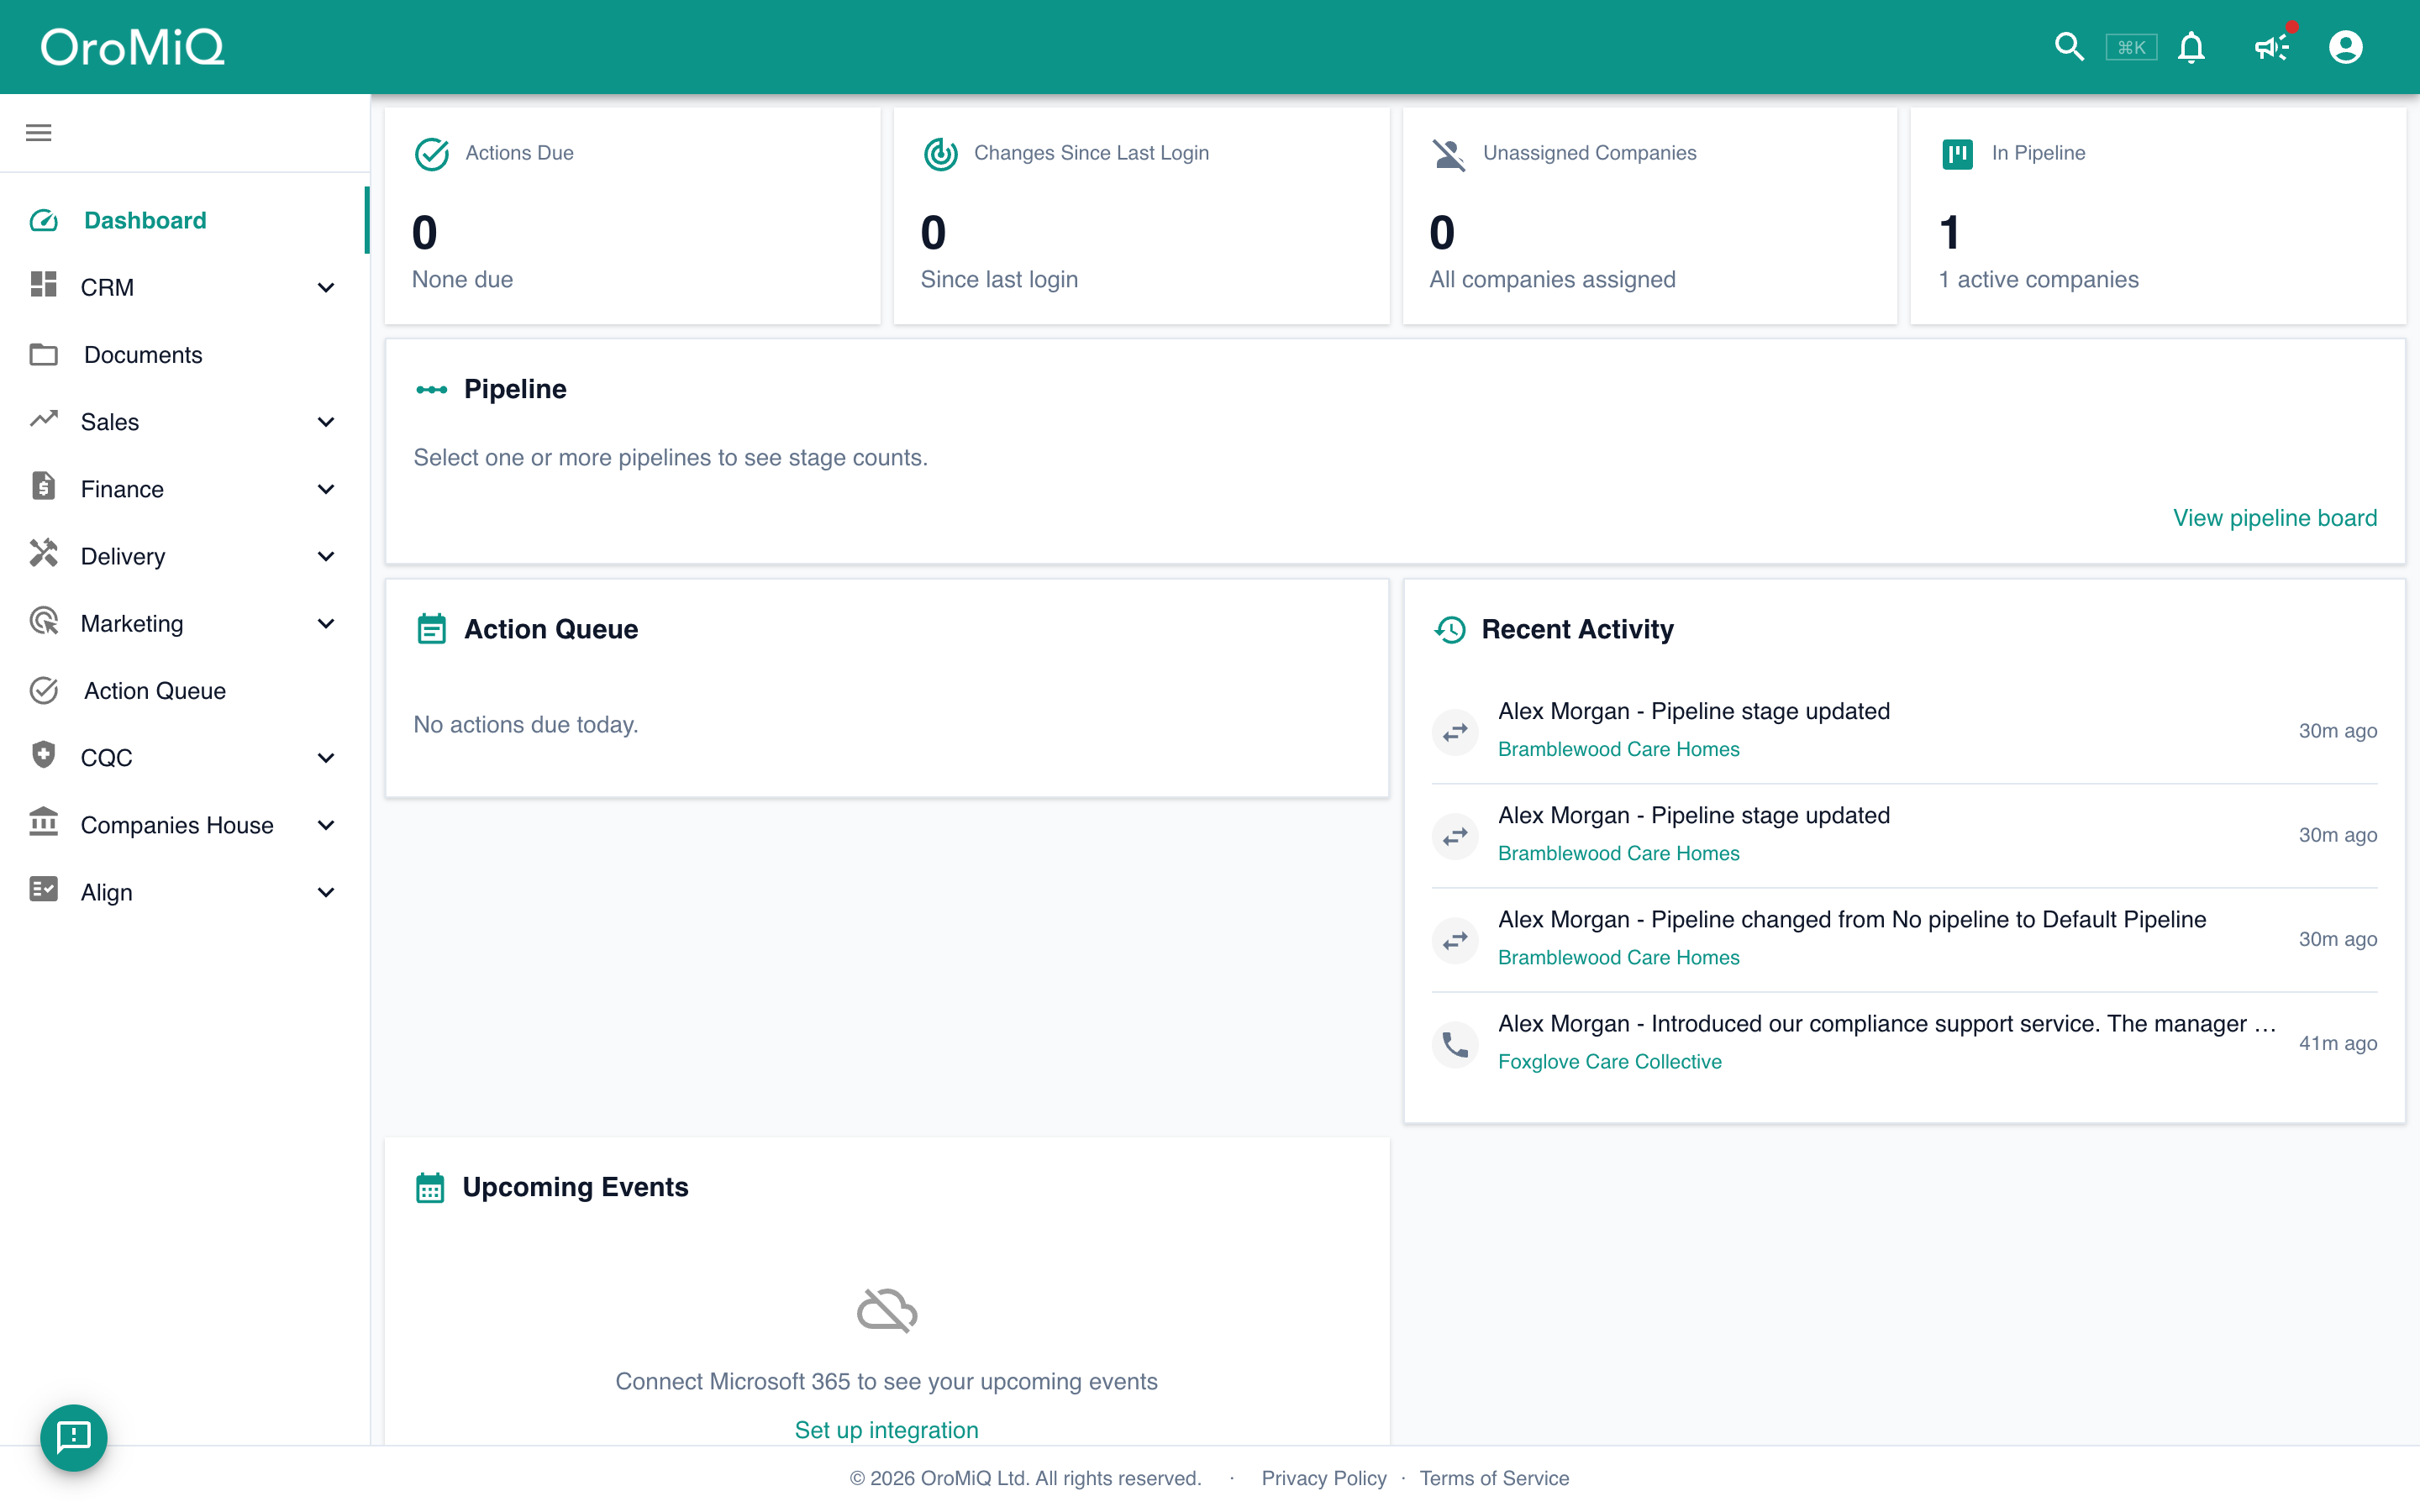
When you sign in you land in Views, on a dashboard tab called Home. It starts with three widgets: Pipeline summary (live stage counts), Action Queue (what needs doing) and Recent activity. The Home shown here also has the 90-day cash-in forecast and What to push, which you can add in the next step.
In the Pipeline summary, each coloured circle is a stage with the number of records in it. Hover over a circle to see the stage name, click it to open that stage on the board, or click View pipeline board. If you have two or more pipelines, use the Pipelines picker to choose which ones to show.
Note
Choose your widgets
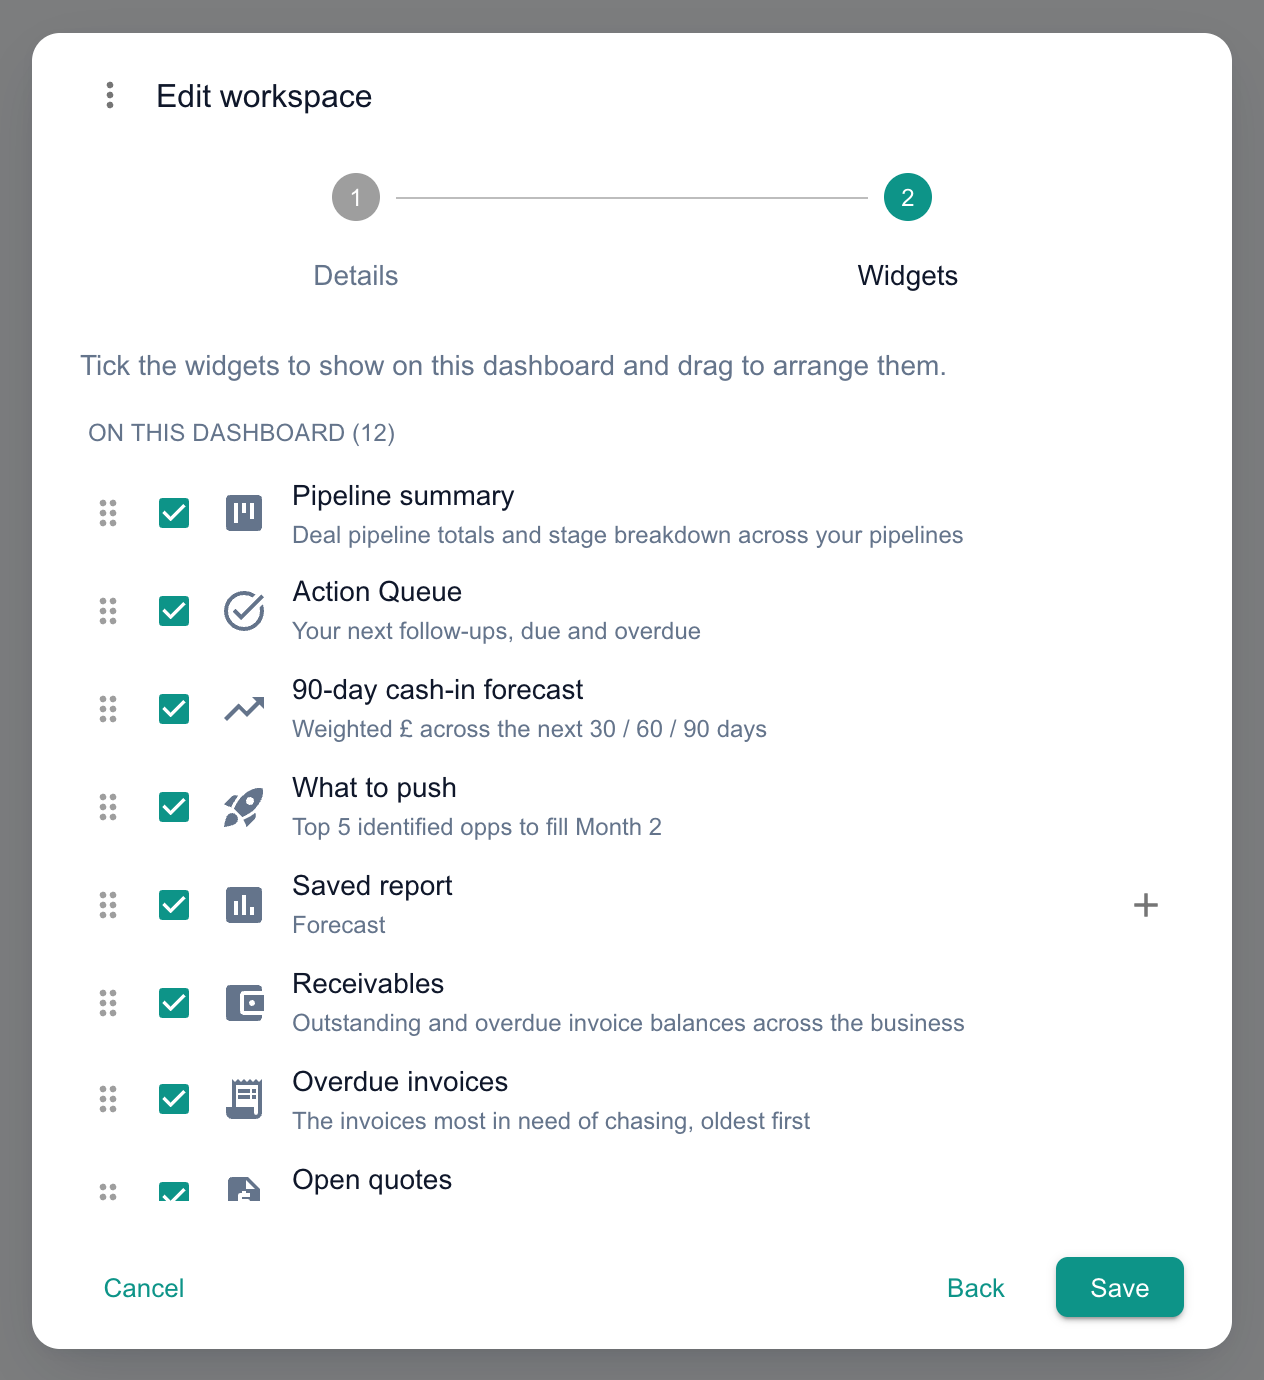
Open the Home tab’s menu, choose Edit, then go to Widgets. Tick the widgets you want and drag them into order. A dashboard with no widgets shows a Choose widgets button that takes you to the same place.
As well as the three Home widgets, you can add What to push, Re-engage queue, 90-day cash-in forecast and Saved report, which shows one of your reports on the dashboard. If your plan includes invoices, quotes or contracts, Receivables, Overdue invoices, Open quotes and Contract renewals appear too.
A dashboard can show several saved reports. Each Saved report row is named after the report it shows; click the + on the row to add another.
Note
Open a report tab
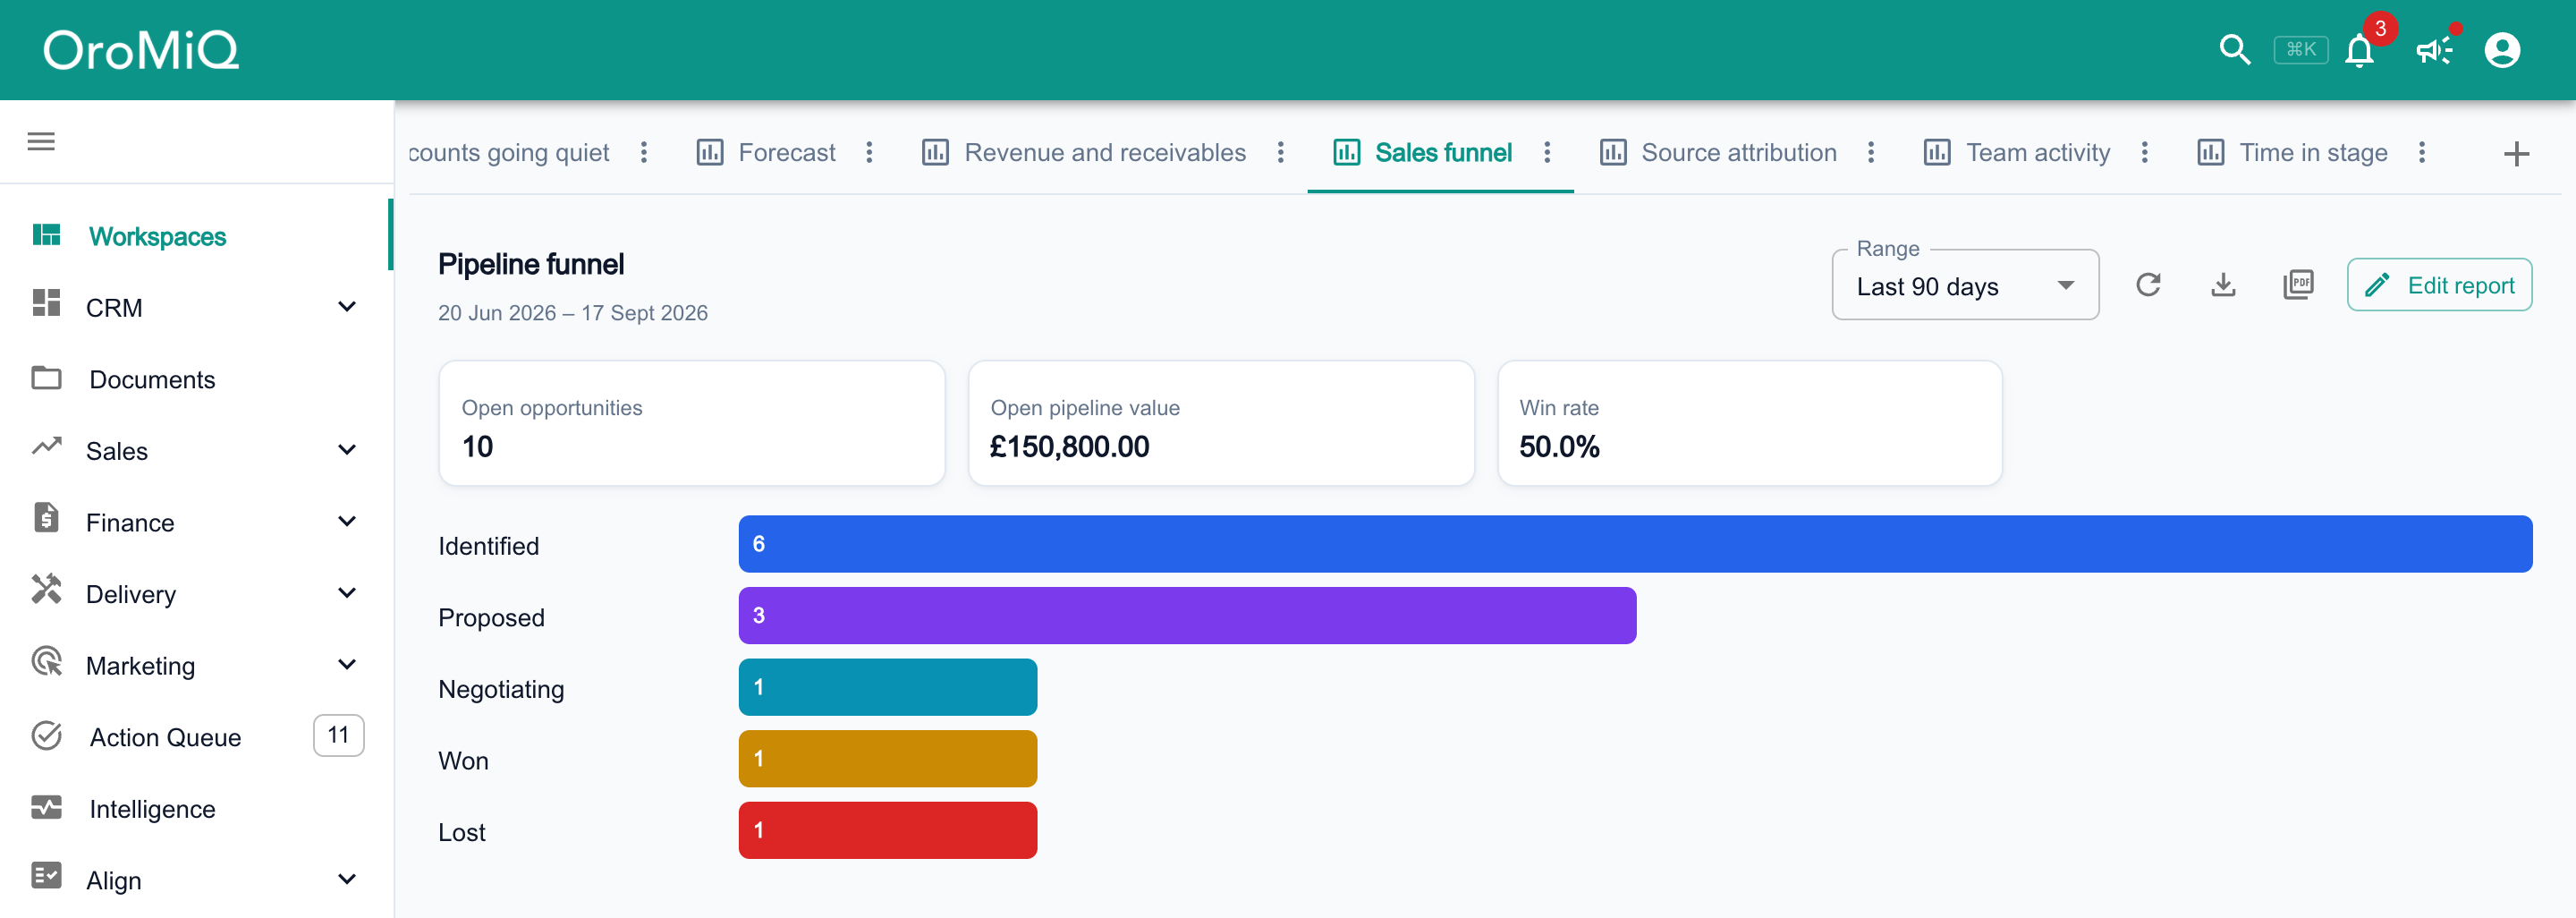
Reports live as tabs alongside your lists, pipelines and dashboards. Open a report tab and it runs for its saved period, showing its headline numbers and a chart or table.
Use the Range dropdown to look at a different period without changing the saved report; Reset takes you back. Use the Export CSV or Export PDF icon to download the figures.
If the report is yours, Edit report opens Details, Parameters and Schedule. Set a schedule to have it emailed automatically; the report then shows a Scheduled chip.
Note
Create your own report
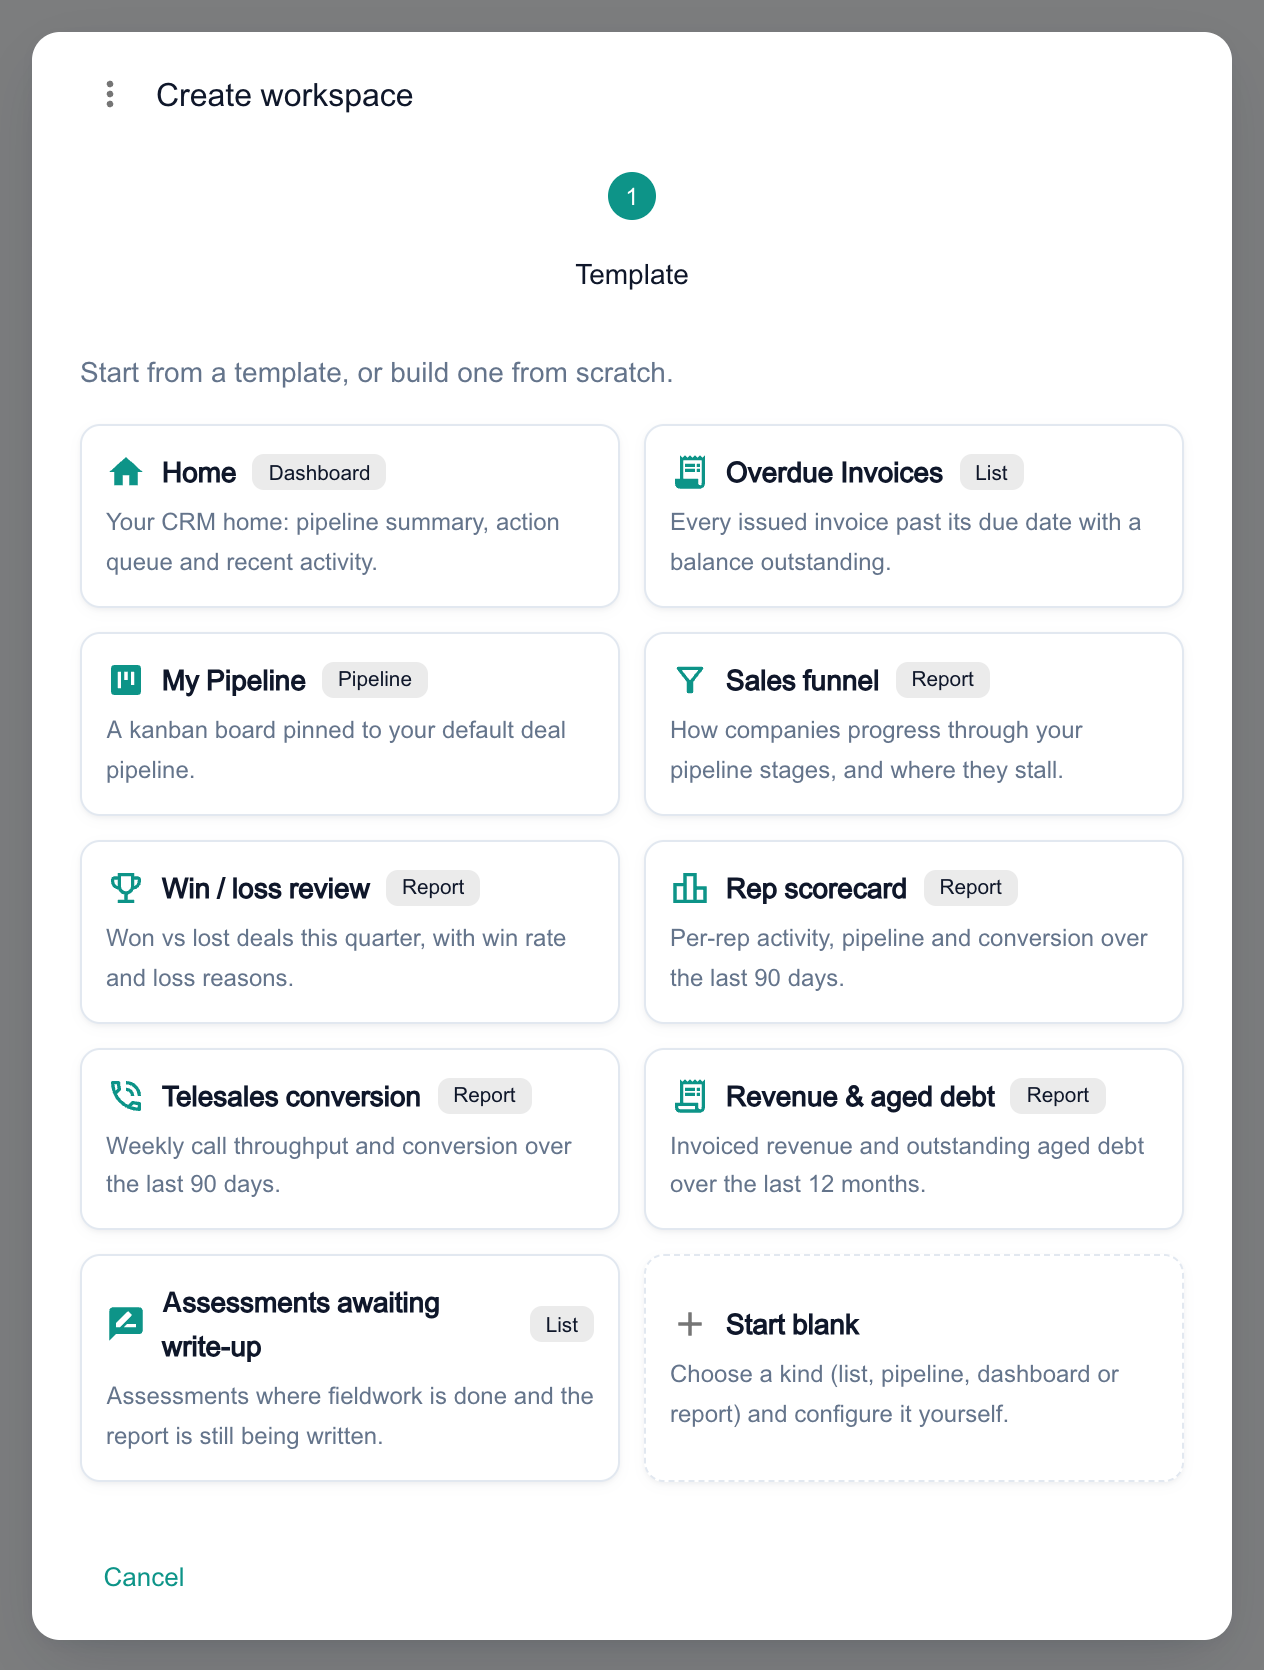
Click the + at the end of the tab strip and choose New view. In Create view, pick a ready-made report such as Sales funnel, Win / loss review or Revenue & aged debt, or choose Start blank and the Report type to build your own: pick the report type, then its period and filters.
Try Start blank, Report, then Source attribution to see which sources bring in your best work. It is the quickest way to learn where to spend your time.
What next
Cannot find what you need? Browse the Help Centre or submit a support ticket.