Understand
Your morning briefing, on one screen
The dashboard pulls your working day together: pipeline health, activity, and what needs doing next, with live numbers that click through to the records behind them.
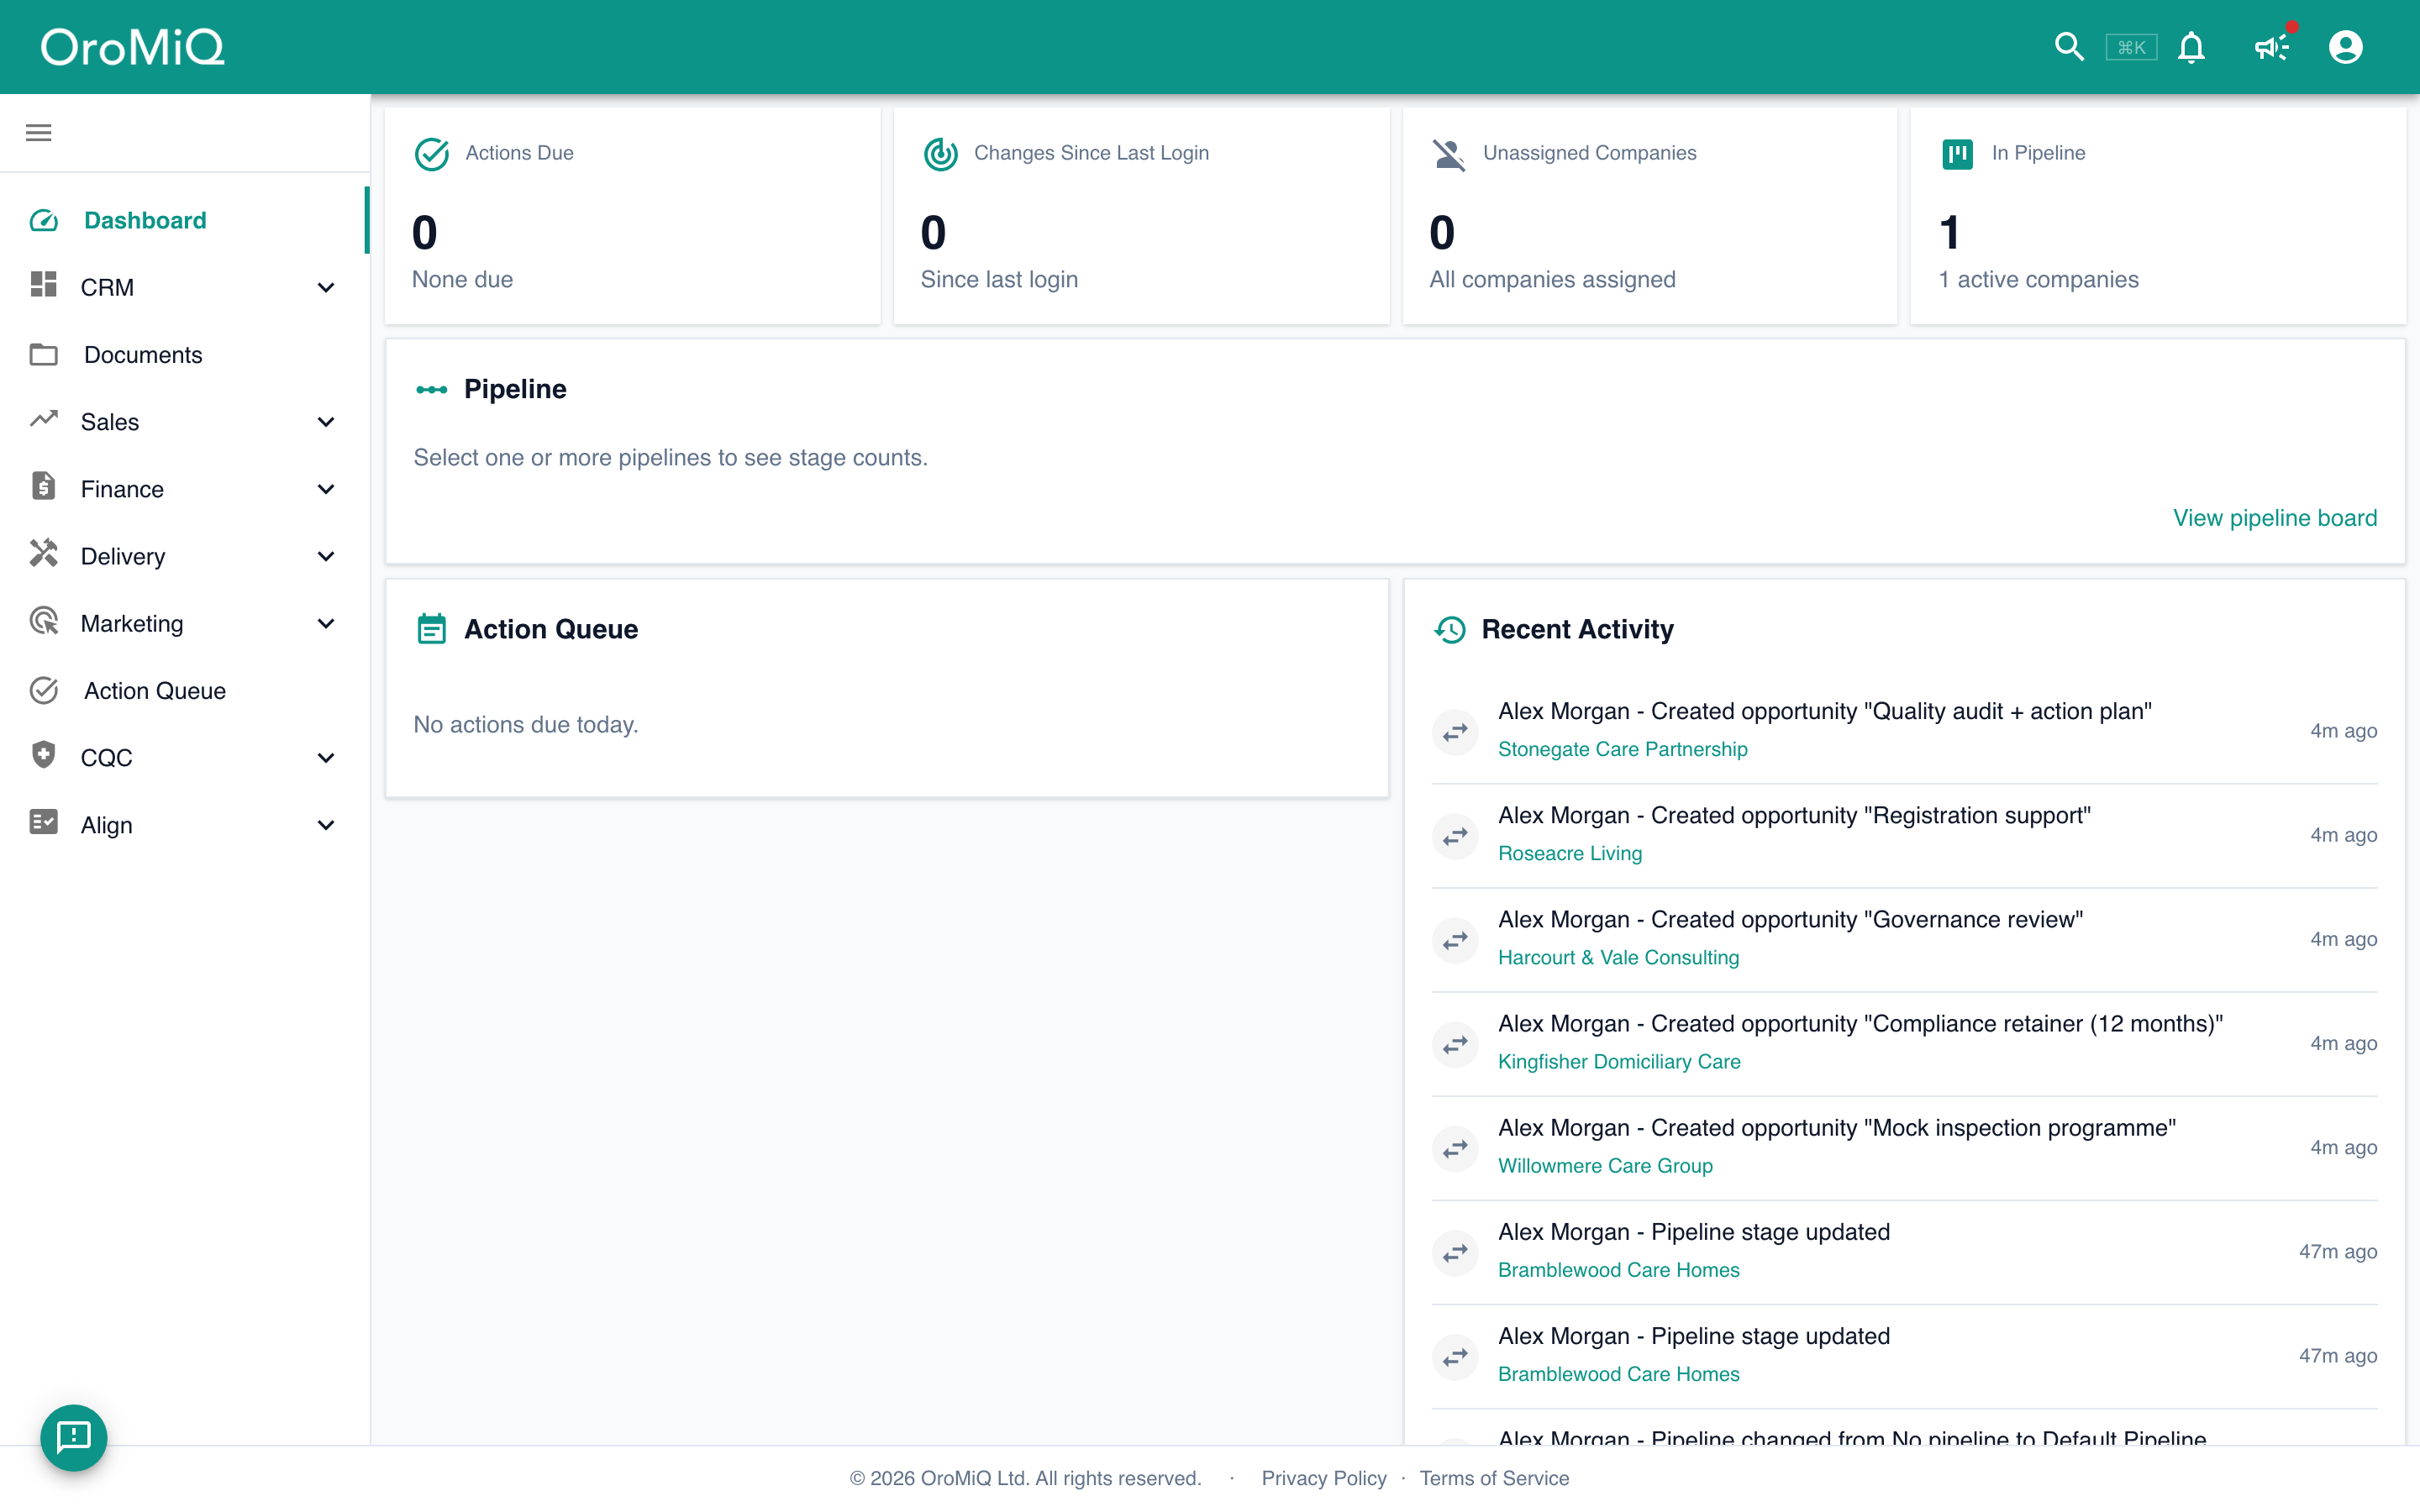
Live CRM data, not wallpaper
Pipeline by stage, activity volume, actions due, revenue in flight. The numbers are the database, not a nightly export.
From glance to action
Every number clicks through to the records behind it, so noticing a problem and working it are the same motion.
Widget dashboards with data layers
Switch on a data layer and its dashboard becomes fully configurable: arrange, resize and remove intelligence widgets to build your own monitoring station.
Works with
Ready to see it with your own pipeline?
Start a 14-day free trial, or book a demo and we will walk it through with you.